Cohen's Kappa: How to Compute and Interpret Agreement
How to compute Cohen's kappa and weighted kappa by hand, read the result honestly, and know when to use Krippendorff's alpha, ICC, or Gwet's AC1 instead.
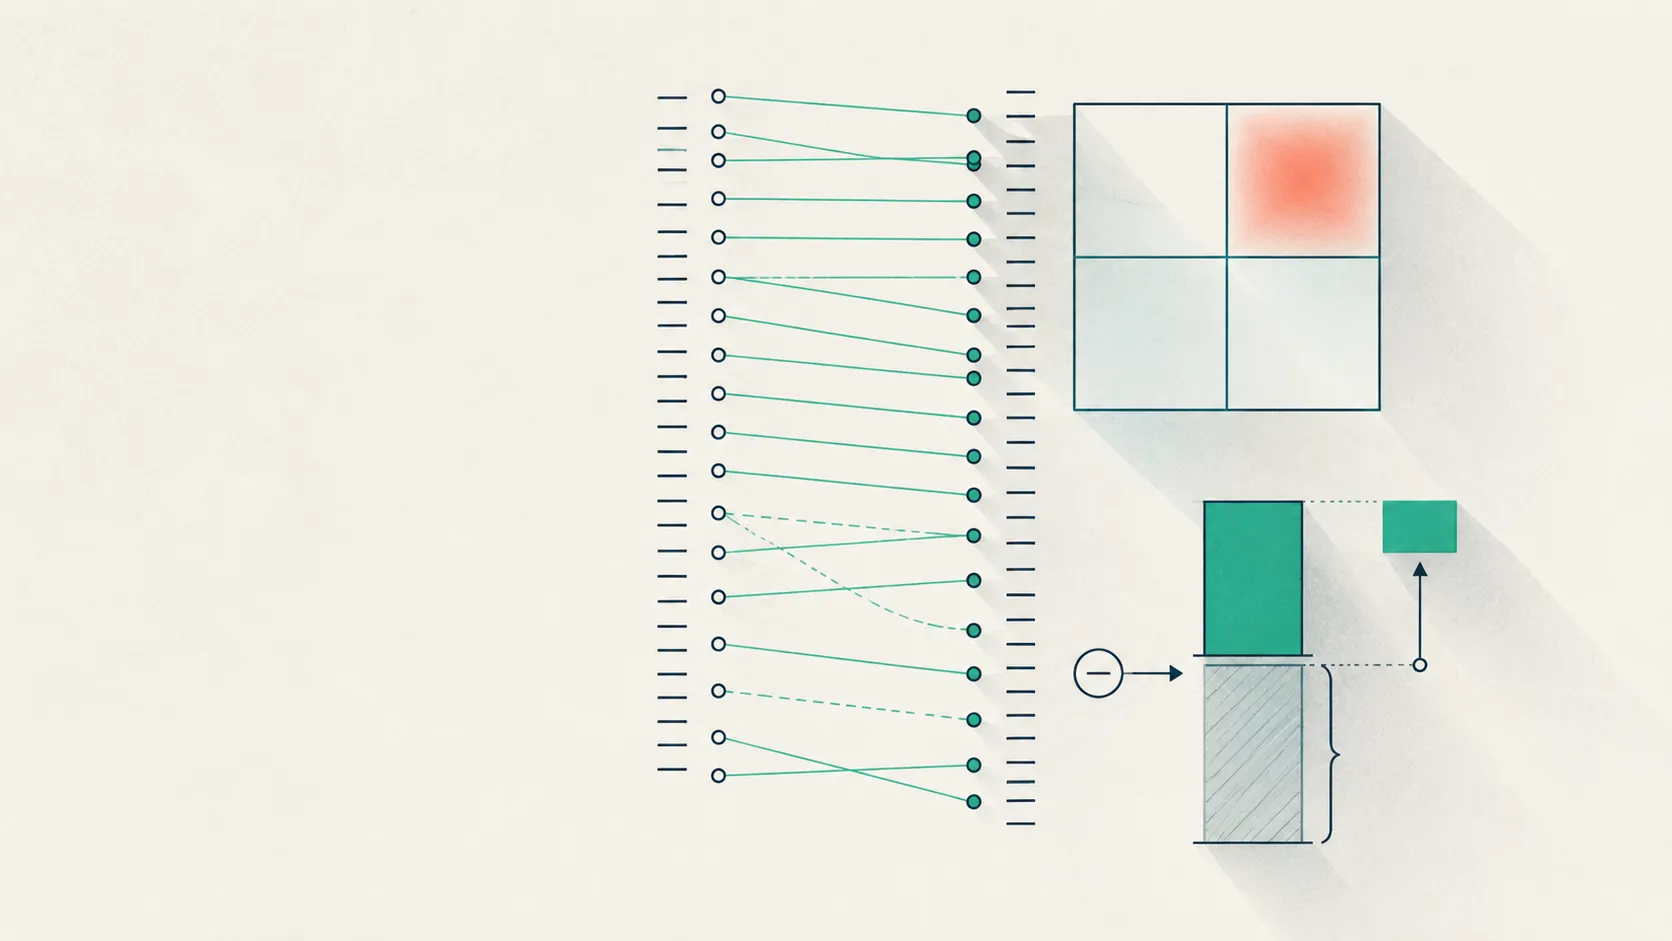
Cohen’s kappa is a single number that tells you how much two raters agree beyond what you would expect from chance alone. That last clause is the whole point: raw percent agreement flatters your data, and kappa is the correction. If you code interview transcripts, rate symptom severity, or label a dataset, kappa is usually the number a reviewer will ask for first—and the one most often misread.
What is Cohen’s kappa?
Cohen’s kappa is a chance-corrected measure of agreement between two raters classifying items into the same set of nominal categories (Cohen, 1960). It ranges from 1 (perfect agreement) down through 0 (agreement no better than chance) and into negative values (agreement worse than chance). The reason it exists is simple: if two raters both label 90% of cases “present” out of habit, they will agree most of the time even if neither is looking at the evidence, and kappa strips that free agreement out.
Kappa is the right tool when your labels are categorical and unordered and you have exactly two raters. For ordered categories, more raters, or continuous scores, you want one of the alternatives in the comparison table below.
How do you compute Cohen’s kappa?
Kappa is observed agreement minus chance agreement, divided by the agreement that was still available above chance:
Work a concrete (synthetic) example. Two raters each judge 100 utterances as showing a phenomenon or not:
| Rater B: Yes | Rater B: No | Row total | |
|---|---|---|---|
| Rater A: Yes | 40 | 10 | 50 |
| Rater A: No | 15 | 35 | 50 |
| Column total | 55 | 45 | 100 |
Observed agreement is the diagonal: (40 + 35) / 100 = 0.75. Chance agreement combines the marginals: (50/100 × 55/100) + (50/100 × 45/100) = 0.275 + 0.225 = 0.50. So κ = (0.75 − 0.50) / (1 − 0.50) = 0.50—moderate, even though the raters agreed three-quarters of the time. The gap between 75% and 0.50 is exactly the chance correction doing its job.
Try it: the inter-rater reliability calculator
Enter your own counts below. The calculator computes percent agreement, expected agreement, and Cohen’s kappa live; switch to three or more categories to get weighted kappa, and load the paradox example to see the failure mode discussed next.
Inter-rater reliability calculator
| A ↓ / B → | B1 | B2 |
|---|---|---|
| A1 | ||
| A2 |
Diagonal cells (green) are agreements. Enter counts of items each pair of raters assigned.
Percent agreement
80.0%
Expected (chance)
50.0%
Cohen's κ
0.600
Interpretation
Moderate
How do you interpret a kappa value?
The most-cited interpretation is the Landis & Koch (1977) scale, but treat its labels as rough signposts, not law:
| Kappa range | Agreement (Landis & Koch, 1977) |
|---|---|
| < 0.00 | Poor (worse than chance) |
| 0.00 – 0.20 | Slight |
| 0.21 – 0.40 | Fair |
| 0.41 – 0.60 | Moderate |
| 0.61 – 0.80 | Substantial |
| 0.81 – 1.00 | Almost perfect |
These cutoffs are arbitrary and were never meant to be universal. For clinical measurement, McHugh (2012) argues they are too lenient and proposes stricter expectations, treating kappa below roughly 0.60 as inadequate for decisions that affect patients. Whatever benchmark you adopt, report the kappa and its 95% confidence interval and state your category base rates, so a reader can judge the number in context rather than trusting a one-word label.
Why can percent agreement be high but kappa low?
Because when one category dominates, most agreement is chance agreement—and kappa removes it. This is the first of the two “kappa paradoxes” documented by Feinstein & Cicchetti (1990): two raters can agree on 85% of cases yet post a kappa near zero if, say, 90% of items truly belong to one category. Percent agreement rewards them for the easy, lopsided calls; kappa does not.
The second paradox is the mirror image. When the two raters’ marginal totals are unbalanced against each other—one rater says “present” far more often than the other—kappa can be pushed artificially higher for the same observed agreement. Together the two paradoxes are why you never interpret a kappa without also reporting the base rates and the marginal distributions that produced it.
Which coefficient should you use—weighted kappa, Krippendorff’s alpha, or ICC?
Cohen’s kappa is one member of a family. Pick the coefficient that matches your raters, your measurement level, and your data completeness:
| Coefficient | Use when | Notes |
|---|---|---|
| Cohen's κ | 2 raters, nominal categories, complete data | Corrects for chance; sensitive to prevalence |
| Weighted κ | 2 raters, ordinal categories | Distant disagreements count more (linear or quadratic weights) |
| Fleiss' κ | 3+ raters, nominal categories | Extends chance-corrected agreement to many raters; equals Scott's π (not Cohen's κ) at two raters (Fleiss, 1971) |
| Krippendorff's α | Any raters, any scale, missing data | The most flexible option (Krippendorff, 2004) |
| ICC | Continuous or many-level ordinal ratings | Choose the form by model and agreement-vs-consistency (Koo & Li, 2016) |
| Gwet's AC1 | High agreement with skewed prevalence | Robust to the kappa paradox (Gwet, 2008) |
To see weighted kappa in action, switch the calculator above to three or more categories and toggle linear versus quadratic weights: a one-step disagreement (say, “mild” vs “moderate”) then costs far less than a three-step one (“none” vs “severe”), which is exactly what you want for an ordinal scale. Quadratic weighting is the common default and, on a square table, makes weighted kappa equivalent to an intraclass correlation.
For a broader tutorial on choosing and computing these on real observational data, Hallgren (2012) is the clearest single reference. The short version: weighted kappa for ordered severity ratings, Krippendorff’s alpha when raters or missingness vary, and an ICC when you are averaging continuous scores.
Computing kappa on rating-scale data
Rating scales are where this gets practical. A clinician-rated instrument like the MADRS produces an ordinal severity score per item, so weighted kappa (or an ICC on the total score) is usually the right reliability statistic—a one-point disagreement on an item should not count the same as a four-point one. A screening instrument like the PHQ-9, coded as evidence spans, is closer to nominal per item, where unweighted kappa fits.
In Tagaroo, each rating scale is a live annotation workflow, and inter-rater reliability is computed as raters work—so the coefficient matches the scale’s measurement level automatically, and the confidence interval updates as your sample grows. If you are new here, the welcome post explains how the Scale Library and the blog fit together.
Limitations to keep in view
Kappa is not a single fixed property of an instrument. It moves with the base rates of your sample, so a scale can look reliable in one population and unreliable in another. It also assumes raters are independent and categories are mutually exclusive—assumptions that quietly fail when coders discuss cases or when a codebook has fuzzy boundaries. Treat a kappa as a snapshot of these raters, on this sample, under this codebook, and re-estimate it when any of those change.
The practical upshot: compute kappa, but never report it naked. Pair it with a confidence interval, the base rates, and—when prevalence is skewed—a second coefficient that does not share kappa’s blind spot.
References
- Cohen, J. (1960). A coefficient of agreement for nominal scales. Educational and Psychological Measurement, 20(1), 37–46. doi:10.1177/001316446002000104
- Fleiss, J. L., Cohen, J., & Everitt, B. S. (1969). Large sample standard errors of kappa and weighted kappa. Psychological Bulletin, 72(5), 323–327. doi:10.1037/h0028106
- Fleiss, J. L. (1971). Measuring nominal scale agreement among many raters. Psychological Bulletin, 76(5), 378–382. doi:10.1037/h0031619
- Landis, J. R., & Koch, G. G. (1977). The measurement of observer agreement for categorical data. Biometrics, 33(1), 159–174. doi:10.2307/2529310
- Feinstein, A. R., & Cicchetti, D. V. (1990). High agreement but low kappa: I. The problems of two paradoxes. Journal of Clinical Epidemiology, 43(6), 543–549. doi:10.1016/0895-4356(90)90158-L
- Gwet, K. L. (2008). Computing inter-rater reliability and its variance in the presence of high agreement. British Journal of Mathematical and Statistical Psychology, 61(1), 29–48. doi:10.1348/000711006X126600
- McHugh, M. L. (2012). Interrater reliability: the kappa statistic. Biochemia Medica, 22(3), 276–282. doi:10.11613/BM.2012.031
- Koo, T. K., & Li, M. Y. (2016). A guideline of selecting and reporting intraclass correlation coefficients for reliability research. Journal of Chiropractic Medicine, 15(2), 155–163. doi:10.1016/j.jcm.2016.02.012
- Hallgren, K. A. (2012). Computing inter-rater reliability for observational data: an overview and tutorial. Tutorials in Quantitative Methods for Psychology, 8(1), 23–34. doi:10.20982/tqmp.08.1.p023
- Krippendorff, K. (2004). Content Analysis: An Introduction to Its Methodology (2nd ed.). Sage Publications.
Frequently asked questions
- What is a good Cohen's kappa value?
- By the Landis & Koch (1977) convention, kappa above 0.80 is almost perfect, 0.61–0.80 substantial, and 0.41–0.60 moderate. But these bands are arbitrary; McHugh (2012) argues for stricter cutoffs in clinical work, where kappa below about 0.60 is often inadequate. Report the value and its confidence interval, not just a label.
- Why is my percent agreement high but my kappa low?
- This is the kappa paradox (Feinstein & Cicchetti, 1990). When one category dominates the data, raters agree often just by chance, so kappa subtracts most of that agreement away. With skewed prevalence, report Gwet's AC1 alongside kappa—it is far more stable under those conditions (Gwet, 2008).
- When should I use weighted kappa instead of Cohen's kappa?
- Use weighted kappa when your categories are ordinal (for example, severity ratings), so that a one-step disagreement counts less than a three-step one. Linear weights penalize disagreements in proportion to their distance; quadratic weights penalize larger gaps much more heavily.
- Cohen's kappa vs Krippendorff's alpha—which should I report?
- Cohen's kappa handles exactly two raters and complete data. Krippendorff's alpha generalizes to any number of raters, any measurement level, and missing data, which makes it the safer default for content-analysis projects. For continuous ratings, use an intraclass correlation coefficient instead.
Keep reading
 Reliability & Agreement
Confidence Interval for Kappa, Alpha, and ICC, Done Right
Why a bare agreement number misleads, and how to build a confidence interval for kappa, alpha, and the ICC. See analytic vs bootstrap methods.
 Reliability & Agreement
Percent Agreement, Reconsidered: When It's Actually Fine
Raw percent agreement isn't useless. When to chance-correct, when kappa misleads, and when agreement plus a confidence interval is the honest report.
 Reliability & Agreement
Span-Level Agreement: Why Kappa Fails, Use F1 and IoU
Cohen's kappa needs a fixed item set that span and NER annotation never has. Measure span-level agreement with pairwise F1 and IoU instead—see how.
Put this into practice
Tagaroo turns any rating scale or coding scheme into a guided annotation workflow—with inter-rater reliability computed as you go.