Confidence Interval for Kappa, Alpha, and ICC, Done Right
Why a bare agreement number misleads, and how to build a confidence interval for kappa, alpha, and the ICC. See analytic vs bootstrap methods.
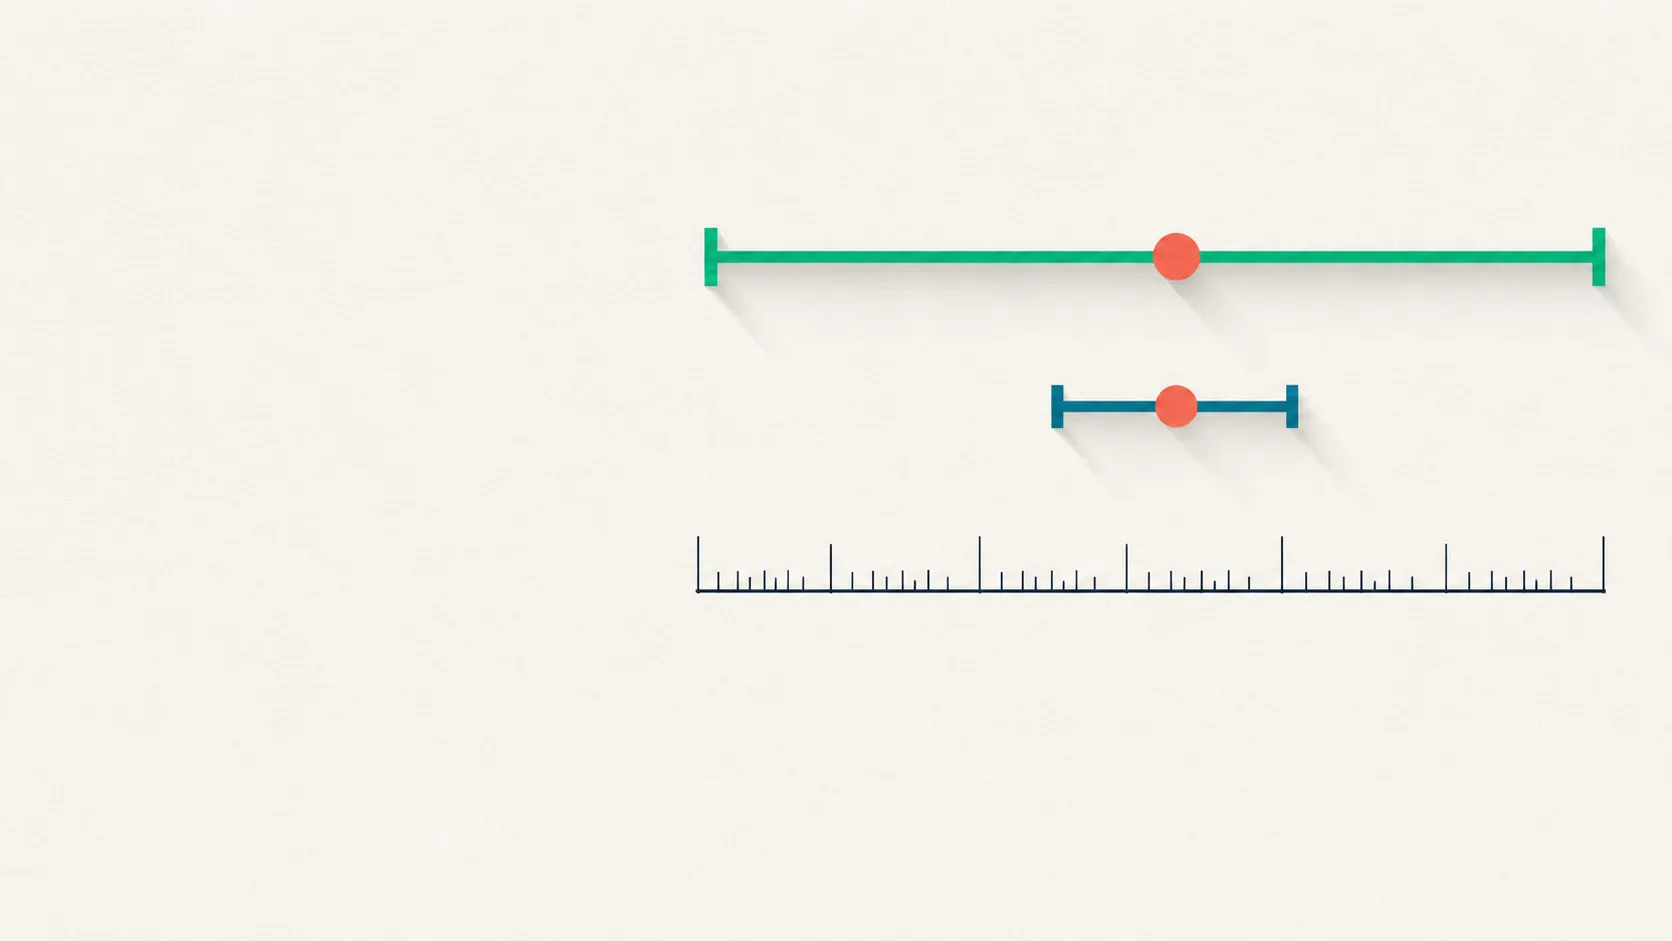
Two labs report the same headline: “inter-rater reliability was good, κ = 0.60.” One computed it from 20 double-coded interviews; the other from 200. Reported as a single number, the two claims look identical. They are not remotely the same claim, and the thing that separates them is the one number most annotation projects never print: the confidence interval.
A confidence interval for kappa turns “we got 0.60” into “the true agreement is somewhere in this range,” and on a small sample that range can be embarrassingly wide. This is a working guide to building honest intervals for Cohen’s and Fleiss’ κ, Krippendorff’s α, and the ICC, when to use an analytic formula versus a bootstrap, and how a wide interval quietly exposes an underpowered reliability study. Every worked number below is synthetic and hand-reproducible.
Why does a bare agreement number mislead?
A bare agreement number misleads because a reliability coefficient is an estimate from a sample, and every estimate carries sampling error that the single value hides. Kappa, alpha, and the ICC are all computed from a finite set of double-coded items, so each is a point on a sampling distribution, not a fixed property of your codebook. Report the point alone and you have thrown away the one piece of information a reader needs to judge it: how much it would move if you coded a different sample.
The confidence interval is that missing information made explicit. It answers “given this much data, where could the true coefficient plausibly be?” and its width is driven mostly by sample size. Reporting guidelines for reliability studies ask for exactly this, on the grounds that a point estimate alone has limited meaning (Zapf et al., 2016). The habit of stopping at the point estimate is so common that our guide to which IRR coefficient to use is only half the job: choosing the right coefficient and then reporting it nakedly still fails the reader.
The same κ = 0.60 means two different things at n = 20 and n = 200
Here is the lesson in one capsule. Take a two-category rating with roughly balanced marginals and a kappa of exactly 0.60. For a symmetric two-by-two table, kappa’s large-sample standard error is well approximated by SE ≈ 0.8 / √n, so the interval collapses predictably as the sample grows. The point estimate is identical in both rows below; the intervals are not comparable claims.
| Sample | κ (point) | ≈ SE | 95% CI | Landis & Koch reading |
|---|---|---|---|---|
| n = 20 items | 0.60 | 0.18 | 0.25 to 0.95 | spans fair to almost perfect |
| n = 200 items | 0.60 | 0.06 | 0.49 to 0.71 | moderate to substantial |
At n = 20 the interval runs from 0.25 to 0.95. That is not a finding; it is a shrug. The data cannot distinguish “fair” agreement from “almost perfect,” so any adjective you attach to the 0.60 is unearned.
At n = 200 the same 0.60 comes with an interval of 0.49 to 0.71, which is a real claim: agreement is moderate to substantial and comfortably above chance. A κ of 0.60 from a handful of cases and a κ of 0.60 from a few hundred are not the same statement, and the confidence interval is the only thing that says so out loud.
Analytic vs bootstrap confidence intervals: which coefficient needs which?
There are two families of method, and the right one depends on the coefficient. An analytic (asymptotic) interval assumes the coefficient is approximately normal and plugs a closed-form standard error into κ ± 1.96·SE. A bootstrap interval makes no such assumption: it resamples your rated items with replacement a few thousand times, recomputes the coefficient on each resample, and reads the 95% interval off the 2.5th and 97.5th percentiles of the resulting distribution (Efron & Tibshirani, 1993). The bootstrap is more general and harder to fool; the analytic formula is faster and, for some coefficients, exact.
The short version is in the table. The rest of this piece explains each row.
| Coefficient | Recommended CI method | Why |
|---|---|---|
| Cohen's κ (2 raters) | Analytic for large, balanced samples; bootstrap otherwise | Classic SE degrades under skew and near the ceiling (Gwet, 2008) |
| Weighted κ (ordinal) | Analytic delta-method SE or bootstrap | Distance weights complicate the variance; bootstrap is safer |
| Fleiss' κ (3+ raters) | Bootstrap | Asymptotic interval had poor coverage away from the null (Zapf et al., 2016) |
| Krippendorff's α | Bootstrap only | Sampling distribution is not known in closed form (Krippendorff, 2018) |
| ICC (continuous) | Analytic F-distribution interval | Exact under the ANOVA normal model (Shrout & Fleiss, 1979; McGraw & Wong, 1996) |
Our own agreement calculator reports both kinds of interval on exactly this split: an analytic 95% interval for Cohen’s and Fleiss’ kappa, and a seeded percentile bootstrap interval for Krippendorff’s alpha.
How do you compute a confidence interval for kappa?
For Cohen’s kappa with two raters, a confidence interval for kappa can start analytic and switch to the bootstrap when the analytic version stops being trustworthy. The analytic recipe is κ ± 1.96 × SE(κ), where the standard error comes from kappa’s large-sample variance. This works acceptably when the sample is large and the category marginals are not badly skewed.
It has two well-documented failure modes. It degrades when one category dominates, the same skew that drives the kappa paradox and pushes teams toward Gwet’s AC1, and it misbehaves as agreement approaches the ceiling, because the classic variance formula was not built for that corner.
Gwet (2008) addressed the high-agreement failure directly, deriving linearized variance estimators that stay well-behaved even when raters almost always agree, so a usable interval is computable precisely where the textbook formula breaks. That is why modern reliability packages report an interval by default rather than leaving it to the analyst.
When the marginals are skewed, the sample is small, or κ is high, switch to the bootstrap: resample the rated items with replacement, recompute κ several thousand times, and take the percentile interval (Efron & Tibshirani, 1993). The bootstrap does not care that the sampling distribution is asymmetric near the boundary, which is exactly the situation that defeats the normal approximation. For the mechanics of the point estimate itself, the two-rater arithmetic is worked in our Cohen’s kappa walkthrough.
Why Fleiss’ kappa and Krippendorff’s alpha need the bootstrap
For three or more raters, the analytic interval stops being trustworthy and the bootstrap becomes the default. Zapf and colleagues (2016) ran a large simulation study on nominal data and found that the asymptotic confidence interval for Fleiss’ kappa held only when the true value was zero: for any shifted null, its coverage probability fell well below the nominal 95%, even at samples up to 1,000. The delta-method standard error underlying that interval tends to run too narrow, which inflates the type-one error rate (a point Efron made about the delta method in general). Their bootstrap intervals, by contrast, covered close to the intended 95% across scenarios.
Krippendorff’s alpha forces the issue entirely. Its sampling distribution is not known in closed form, so there is no asymptotic standard error to plug in; the bootstrap is not the better option but the only option (Krippendorff, 2018; Zapf et al., 2016). Alpha’s other advantages, any number of raters, any measurement level, and tolerance of missing data, make it the natural one-size choice for messy coding projects, and the price is that you must resample to get its interval.
The full computation, including the distance function that changes alpha’s value, is in our guide to Krippendorff’s alpha computed by hand and in code. Practical note: use enough resamples (a few thousand) and resample the coding units, not individual ratings, so the interval reflects the real unit of analysis.
Confidence intervals for the ICC are the well-behaved exception
The intraclass correlation is the one coefficient whose analytic interval you can trust without apology. Because the ICC is defined through variance components from an analysis of variance, its confidence limits follow from the F distribution of the ratio of mean squares, giving an exact interval under the normal model rather than a large-sample approximation (Shrout & Fleiss, 1979). This is a genuinely different footing from the kappa family, where the analytic interval is only asymptotic.
The catch is that “the ICC” is as many as ten distinct coefficients, not one, and the interval depends on which you chose. McGraw and Wong (1996) laid out the forms: a one-way random model (single-measure and average-measure versions, absolute agreement only, since there is no shared-rater structure to define “consistency” against), plus two-way random and two-way mixed models, each split into single- versus average-measure and into a consistency versus an absolute-agreement version, with interval formulas given for each. The same ratings yield different ICCs and different intervals across these models, so reporting the number without the form is as incomplete as reporting kappa without its interval.
Our guide to choosing an ICC form walks the decision, and the standard interpretation bands for the resulting value come from Koo and Li (2016). When the normality assumption behind the ANOVA is shaky, a bootstrap interval is a defensible fallback for the ICC too.
How wide intervals expose a small reliability sample
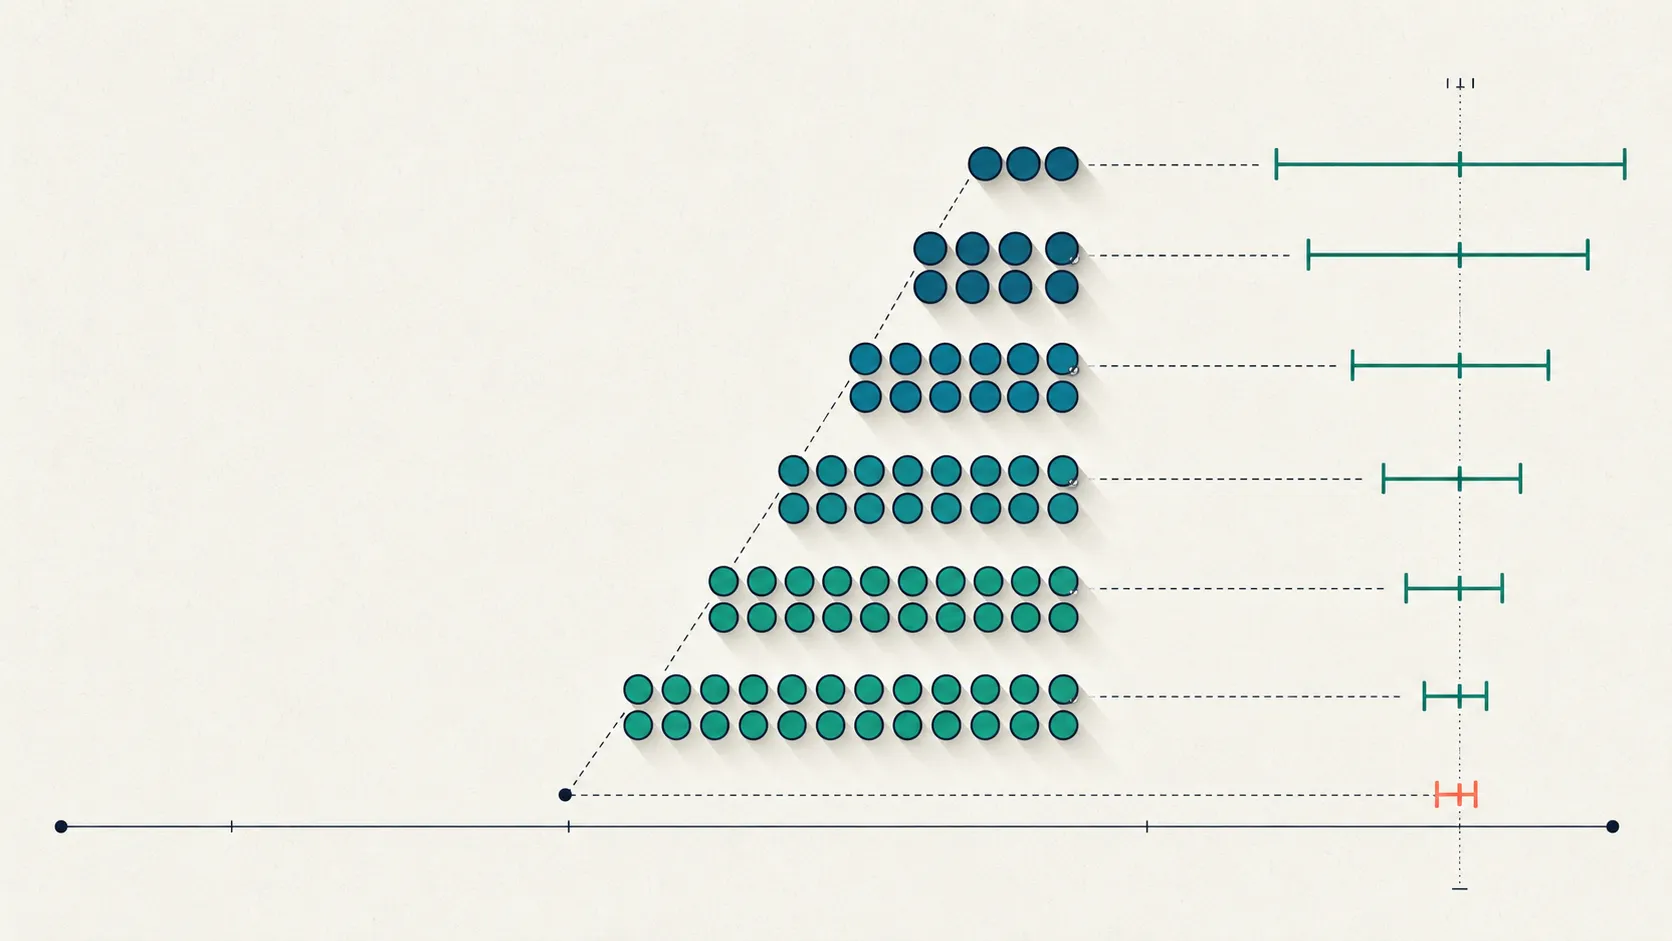
A wide confidence interval is not a nuisance to be minimized; it is a truthful readout of how little the reliability sample can support. Interval width shrinks roughly with the square root of the number of coded units, so quadrupling the sample only halves the interval. That is why the n = 20 case above produced a range from 0.25 to 0.95: twenty items simply cannot pin agreement down, and the interval refuses to pretend otherwise. When a reviewer sees a reliability claim with no interval, the first suspicion is that the interval was omitted because it was wide, which is precisely when planning matters most, as our guide to how large a reliability sample you need lays out.
This also fixes how you should benchmark. Comparing a point estimate against a threshold like “substantial, above 0.61” treats a noisy number as if it were exact. The disciplined move is to compare the interval against the benchmark: agreement is credibly substantial only if the lower bound clears the threshold, and it beats chance only if the lower bound sits above zero (Zapf et al., 2016).
Gwet (2014) formalizes this as probabilistic benchmarking, scoring an observed coefficient against the Landis and Koch ranges by the probability that its true value falls in each band rather than by where the single estimate happens to land. Read that way, the interval is a significance test you already have in hand (Cohen, 1960; Landis & Koch, 1977).
Report the interval, not just the number
The practical upshot is a one-line habit: never report an agreement coefficient without the interval and the method that produced it. A confidence interval for kappa, alpha, or an ICC costs a single clause to report and changes how much a reader can trust the number. Write “κ = 0.60 (95% bootstrap CI 0.49 to 0.71, n = 200),” name whether the interval is analytic or bootstrapped, and state the sample size, so a reader can judge the claim instead of trusting an adjective. Our inter-rater reliability reporting template drops these fields into a methods paragraph you can paste into a manuscript.
Clinician-rated ordinal instruments make the stakes concrete. Reliability for the Montgomery-Åsberg Depression Rating Scale (MADRS) is often summarized as a weighted kappa or an ICC across raters, and whether that number is stable depends entirely on how many interviews were double-scored, which the interval reveals. The same holds for span-level thought-disorder coding on Andreasen’s Thought, Language and Communication (TLC) scale, where a small pilot can produce a flattering point estimate wrapped in an interval that says “we do not really know yet.”
In Tagaroo, double-coding runs as a live workflow and the reliability figures come out with an interval attached and the method labeled, matched to each scale’s measurement level, so the number you report is already the honest one. Pick the coefficient for your data, choose the analytic or bootstrap interval that fits it, and let the width, not the point estimate, carry the weight of the claim. That is the difference between a number and a defensible reliability result.
References
- Efron, B., & Tibshirani, R. J. (1993). An Introduction to the Bootstrap. Chapman & Hall/CRC. doi.org/10.1201/9780429246593
- Zapf, A., Castell, S., Morawietz, L., & Karch, A. (2016). Measuring inter-rater reliability for nominal data – which coefficients and confidence intervals are appropriate? BMC Medical Research Methodology, 16, 93. doi.org/10.1186/s12874-016-0200-9
- Krippendorff, K. (2018). Content Analysis: An Introduction to Its Methodology (4th ed.). SAGE Publications.
- Shrout, P. E., & Fleiss, J. L. (1979). Intraclass correlations: uses in assessing rater reliability. Psychological Bulletin, 86(2), 420–428. doi.org/10.1037/0033-2909.86.2.420
- McGraw, K. O., & Wong, S. P. (1996). Forming inferences about some intraclass correlation coefficients. Psychological Methods, 1(1), 30–46. doi.org/10.1037/1082-989X.1.1.30
- Gwet, K. L. (2008). Computing inter-rater reliability and its variance in the presence of high agreement. British Journal of Mathematical and Statistical Psychology, 61(1), 29–48. doi.org/10.1348/000711006X126600
- Gwet, K. L. (2014). Handbook of Inter-Rater Reliability (4th ed.). Advanced Analytics, LLC.
- Koo, T. K., & Li, M. Y. (2016). A guideline of selecting and reporting intraclass correlation coefficients for reliability research. Journal of Chiropractic Medicine, 15(2), 155–163. doi.org/10.1016/j.jcm.2016.02.012
- Landis, J. R., & Koch, G. G. (1977). The measurement of observer agreement for categorical data. Biometrics, 33(1), 159–174. doi.org/10.2307/2529310
- Cohen, J. (1960). A coefficient of agreement for nominal scales. Educational and Psychological Measurement, 20(1), 37–46. doi.org/10.1177/001316446002000104
Frequently asked questions
- How do I compute a confidence interval for kappa?
- Two routes exist. The analytic route puts a normal interval around the estimate using kappa's large-sample standard error: 95% CI = kappa ± 1.96 × SE. Gwet (2008) derived variance estimators that stay well-behaved even when raters almost always agree, which the classic formula does not. The bootstrap route resamples your rated items with replacement a few thousand times, recomputes kappa each time, and reads the interval off the 2.5th and 97.5th percentiles of that distribution (Efron & Tibshirani, 1993). Prefer the bootstrap for small samples, skewed marginals, or agreement near the ceiling, where the normal approximation is least trustworthy.
- Do I need a confidence interval if my kappa is already high?
- Yes, and high agreement is exactly where the classic analytic interval fails. The standard large-sample variance misbehaves as kappa approaches 1, so a bare high number can hide a wide interval on a small sample. Gwet (2008) built variance estimators specifically for the high-agreement case, and a bootstrap sidesteps the distributional assumption entirely (Efron & Tibshirani, 1993). Report the interval regardless of how good the point estimate looks.
- What is the difference between an analytic and a bootstrap confidence interval?
- An analytic (asymptotic) interval assumes the coefficient is approximately normally distributed and uses a closed-form standard error. A bootstrap interval makes no distributional assumption: it resamples the data thousands of times and reads the interval from the empirical spread of the recomputed coefficient (Efron & Tibshirani, 1993). For Fleiss' kappa, Zapf et al. (2016) found the asymptotic interval had poor coverage away from the null, while the bootstrap interval covered close to the nominal 95%. For Krippendorff's alpha the bootstrap is the only option, because alpha's sampling distribution is not known in closed form (Krippendorff, 2018).
- Can I use a confidence interval to test whether agreement beats chance?
- Yes. A confidence interval is a significance test you can read directly. If the lower bound of the 95% interval sits above 0, agreement is significantly better than chance at the 5% level; if you want to claim reliability above a threshold such as 0.60, the lower bound must clear that threshold, not the point estimate (Zapf et al., 2016). This is why the interval, not the single number, is what a benchmark should be compared against (Gwet, 2014).
- How do confidence intervals for the ICC differ from those for kappa?
- The intraclass correlation has an exact analytic interval built from the F distribution of the mean squares in its underlying ANOVA, so, unlike kappa, its standard interval is well-founded under the normal model (Shrout & Fleiss, 1979; McGraw & Wong, 1996). You still must report which ICC form you computed, because the same data gives different values and intervals under the one-way, two-way random, and two-way mixed models. When the normality assumption is doubtful, a bootstrap interval is a reasonable fallback.
Keep reading
 Reliability & Agreement
Sample Size for Inter-Rater Reliability: Subjects and Raters
Set the sample size for inter-rater reliability: how many subjects and raters pin kappa or an ICC to a target CI width. See the planning tables.
 Reliability & Agreement
Which Inter-Rater Reliability Coefficient Should You Use?
Which inter-rater reliability coefficient to use, by data type, rater count, and missing data—a decision guide to kappa, alpha, AC1, and ICC.
 Reliability & Agreement
Krippendorff's Alpha: Nominal, Ordinal & Missing Data
How to compute Krippendorff's alpha: the observed-over-expected disagreement formula for nominal, ordinal, and missing data, with a worked example.
Put this into practice
Tagaroo turns any rating scale or coding scheme into a guided annotation workflow—with inter-rater reliability computed as you go.