Annotation Cost Calculator: Budget and Timeline Math
An annotation cost calculator: turn items, labels per item, time, wage, redundancy, and QA overhead into a labeling budget and timeline. See the math.
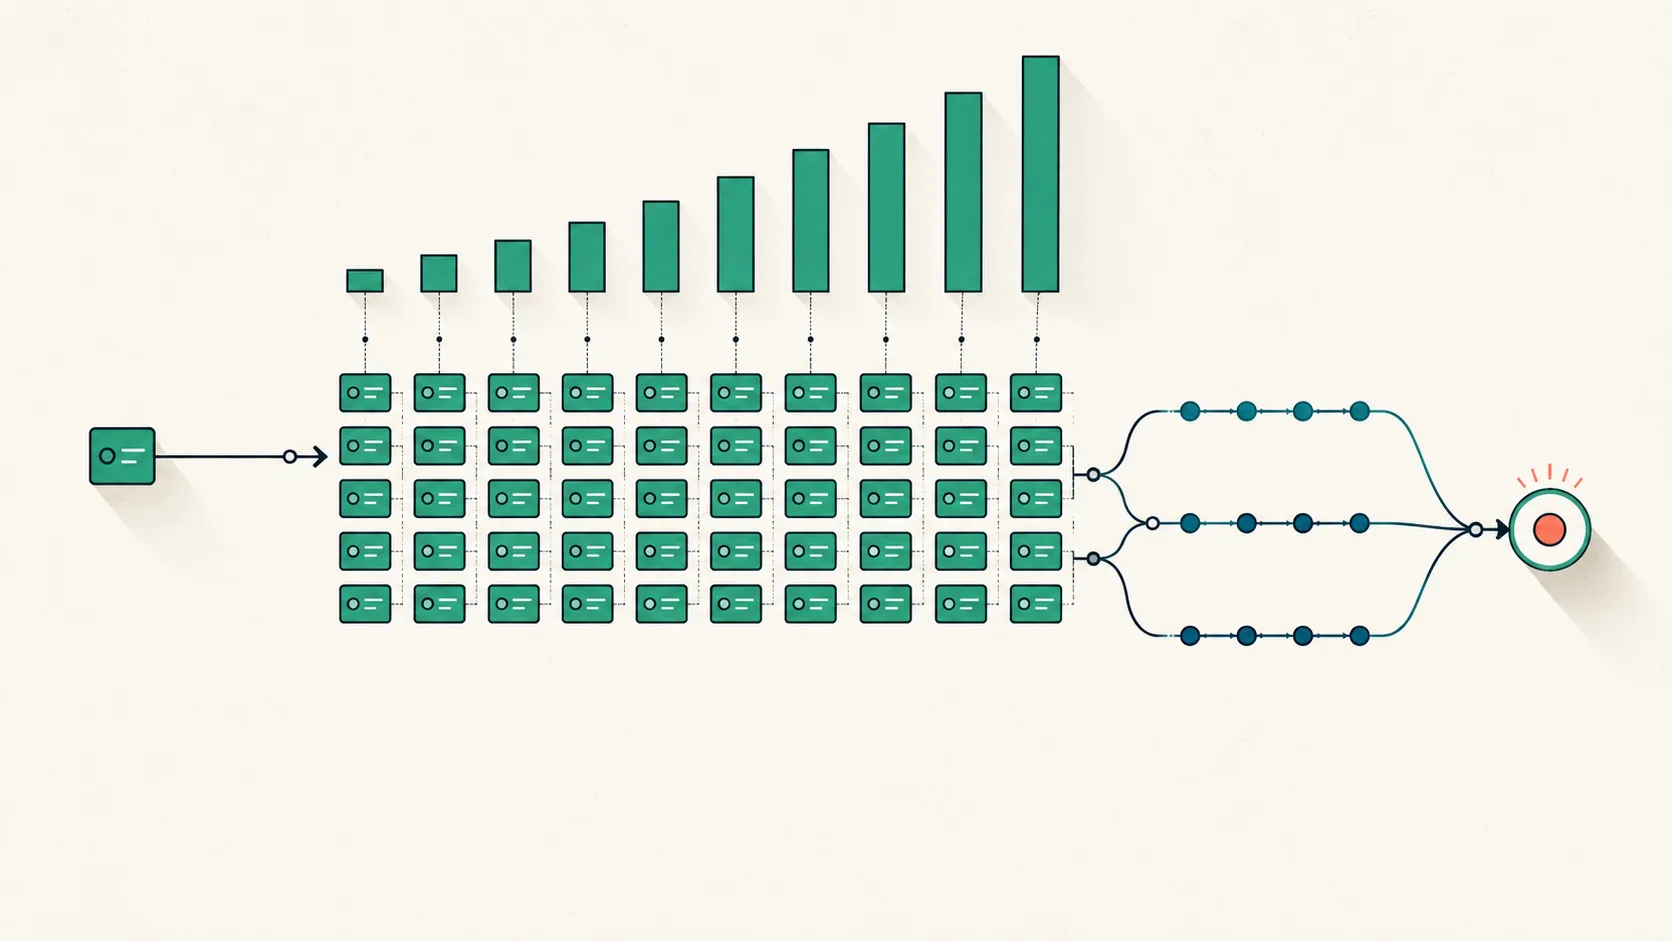
Every annotation budget is four numbers multiplied together, plus two you forget. The four you remember are how many items you have, how many times each gets labeled, how long one label takes, and what an hour of labeling costs. The two you forget—quality assurance and the fixed cost of getting the codebook right—are the ones that blow the estimate. This is a working annotation cost calculator: the formula, what moves each term, and a fully worked synthetic budget you can adapt.
The goal is a number you can defend to whoever signs the check, and a timeline you can defend to whoever needs the data. Both come from the same handful of inputs. Get the inputs honest and the arithmetic is trivial; guess at the inputs and no spreadsheet will save you.
What goes into an annotation cost calculator?
An annotation cost calculator turns six inputs into a budget and a timeline. Five of them set the cost, one is a fixed add-on, and a seventh pair—headcount and productive hours per day—converts the cost into calendar time. Written out, the cost side is a single line you can lift into a spreadsheet cell.
Two of these terms do most of the damage when they are wrong. Time-per-item multiplies against every item and every redundant label, so a bad estimate there scales through the entire budget. Labels-per-item—redundancy—multiplies the base cost by however many independent passes you commission.
The wage feels like the obvious cost driver, but it is usually the term you have the least room to move and the one that matters least to the total. Get the two multipliers right first.
| Input | Symbol | What it is | What moves it |
|---|---|---|---|
| Items | I | Units to label (transcripts, images, spans) | Project scope; sampling vs. full corpus |
| Labels per item | R | Independent passes per item (redundancy) | Reliability target; task subjectivity |
| Time per item | t | Hours one labeler spends on one item | Task complexity; tooling; training |
| Loaded hourly wage | w | Fully loaded cost of an hour of labeling | Labeler expertise; benefits/overhead |
| QA overhead | o | Adjudication + review as a % of base | Disagreement rate; audit intensity |
| Fixed setup | F | Pilot, guidelines, training, tooling | Codebook maturity; team experience |
How much does data labeling cost per label?
Cost per label spans several orders of magnitude, so the number is meaningless until you name the labeler and the task. The cheap end is genuinely cheap: Snow et al. (2008) collected 7,000 non-expert Mechanical Turk annotations for US$2.00, a rate of about 3,500 crowd labels per dollar for a simple affect-recognition task. The expensive end is a trained clinician reading an interview transcript and applying a structured scale, where a single label is minutes of expert attention rather than seconds of a stranger’s.
That spread is why a per-label quote is only useful as a range with a labeler attached to it. Published crowd figures anchor the floor. Trained clinical raters sit far above it, and commercial vendor list prices vary widely enough that they are best obtained by quote rather than assumed. The synthetic figures below sit in the trained-rater band, because the worked task is clinical-transcript annotation; if your task is simpler and your labelers are non-experts, slide every dollar figure down accordingly.
What a labeler actually costs
The wage line hides a gap between what you pay and what the worker keeps, and that gap changes who you can hire and how fast they work. Hara et al. (2018) recorded 2,676 workers doing 3.8 million tasks on Amazon Mechanical Turk and found a median hourly wage of roughly $2, with only about 4% clearing the $7.25 US federal minimum—even though requesters paid an average of $11.58 an hour. Most of the difference is unpaid time: searching for tasks, work that gets rejected, and tasks started but never submitted.
For a clinical or high-stakes project this matters twice. First, the “loaded” wage in the formula is not the sticker rate—it includes the unpaid overhead, benefits, and idle time that turn a $30 nominal rate into a higher real cost per productive hour. Second, paying more is not automatically buying more quality; the relationship is real but conditional, which is exactly what the evidence on whether pay improves annotation quality untangles. Budget the wage honestly, then spend the marginal dollar where it actually moves reliability.
The redundancy multiplier: how many labels per item?
Redundancy is the second-biggest lever in the whole budget because it multiplies the base cost by a whole number. Two independent passes double your labeling cost; three triple it. The question is never “should we double-code?” in the abstract—it is “how many passes does our reliability target actually need, and on which items?”
Snow et al. (2008) gave the classic benchmark: averaging about four non-expert labels per item matched the quality of a single expert annotator on an affect-recognition task, which is why crowd pipelines often commission four or five passes. Expert clinical work usually needs fewer, because the labelers are already calibrated—two independent coders is the common pattern for a reliability check, with a third brought in only to break ties. The right number is a function of your labelers and your task, worked through in detail in our guide to how many annotators per item.
Sheng et al. (2008) add the refinement that saves money: blanket redundancy is wasteful. Their result is that repeated labeling improves quality when individual labels are noisy, but that “repeatedly labeling a carefully chosen set of points is generally preferable” to labeling everything the same number of times.
In budget terms, spend your redundancy where uncertainty is high—the ambiguous, disagreement-prone items—rather than triple-coding the easy 80% that everyone already agrees on. Selective redundancy buys the same reliability for less.
QA and adjudication overhead
Quality assurance is not free and it is not optional, so it belongs in the budget as its own line, not as a rounding error. Once two or more people label the same items, someone has to resolve their disagreements, and that adjudication is real labor: reading the conflicting cases, deciding the correct label, and recording the rule so it does not recur. How you resolve those conflicts—simple majority, weighted vote, a probabilistic model, or expert review—has its own cost and failure modes, laid out in our guide to adjudication and consensus methods.
There is a subtler QA cost that Sheng et al. (2008) name directly: when labeling is cheap, “preparing the unlabeled part of the data can become considerably more expensive than labeling.” Sampling, de-identification, formatting, and loading the data are work that happens before a single label is applied, and on low-cost tasks they can dominate. A 25% overhead is a reasonable synthetic starting assumption for a double-coded project with active adjudication; measure your real disagreement rate in the pilot and adjust it, because a scheme with high disagreement can push QA well past that.
A worked annotation cost calculator example
Here is the annotation cost calculator run end to end on a synthetic project: 2,000 de-identified interview transcripts, annotated for depressive features and disorganized-speech phenomena using two curated clinical scales. Every number is an illustrative planning figure, not a quote. The point is the shape of the arithmetic, not the specific dollars.
The task uses two instruments as its codebooks. The Montgomery-Åsberg Depression Rating Scale is a ten-item clinician-rated measure of depression severity (Montgomery & Åsberg, 1979), and the Scale for the Assessment of Thought, Language and Communication supplies operationally defined items for span-labeling disorganized speech (Andreasen, 1986). Both ship with definitions and anchors, which is what keeps time-per-item and the disagreement rate down.
| Budget line | Fully human (triple-coded) | AI-assisted (review + correct) |
|---|---|---|
| Items (I) | 2,000 | 2,000 |
| Labels per item (R) | 3 | 3 |
| Time per item (t) | 12 min (0.20 h) | 5 min (0.083 h) |
| Labeling hours (I × R × t) | 1,200 h | 500 h |
| Loaded wage (w) | $30/h | $30/h |
| Base labeling cost | $36,000 | $15,000 |
| QA + adjudication (+25%) | $9,000 | $3,750 |
| Fixed setup (F) | $5,000 | $6,000 (+model integration) |
| Total cost | $50,000 | $24,750 |
| Cost per item | $25.00 | $12.38 |
| Cost per label | $8.33 | $4.13 |
Read the fully-human column top to bottom and the levers announce themselves. The 1,200 labeling hours come entirely from the first three lines multiplied together, and $36,000 of the $50,000 total is that single product. QA adds a quarter on top, and the fixed $5,000 for the pilot and guidelines is small in dollars but decisive in outcome. The honest headline numbers are the last two rows: $25 per item and $8.33 per label, which are the figures to compare against any vendor quote or internal estimate—not the total, which just reflects scope. One cost sits upstream of every line in that table: turning the recordings into text in the first place, which our transcription hours and cost calculator sizes separately.
Calendar time versus headcount
A budget answers “how much”; the timeline answers “by when,” and the two are different questions with different bottlenecks. Total productive hours convert to calendar time through headcount, but only up to the point where coordination and reviewer bandwidth take over. The 1,500 productive hours in the worked example (1,200 labeling plus 300 for QA) play out very differently depending on how many people you put on them.
| Coders | Productive h/day (6 per coder) | Working days for 1,500 h | ≈ Calendar weeks |
|---|---|---|---|
| 2 | 12 | 125 | 25 |
| 4 | 24 | 63 | 13 |
| 8 | 48 | 31 | 6 |
Two honest adjustments keep this from being fantasy. First, a productive day is closer to 6 hours than 8 for close-reading annotation, once breaks, ramp-up, and the accuracy decay of sustained vigilance are subtracted. Second, throwing bodies at the problem has diminishing returns: more coders mean more disagreements to adjudicate, more onboarding, and eventually a single overloaded reviewer who becomes the real bottleneck. Headcount compresses the labeling phase; it does not compress the setup phase, and it can quietly inflate the QA phase.
Where AI pre-labeling changes the math
Model-assisted labeling changes exactly one term in the formula—time-per-item—by turning annotation into review-and-correct, and the worked example shows the size of that effect. Dropping time-per-item from 12 to 5 minutes cut the base labeling cost from $36,000 to $15,000 and the total from $50,000 to roughly $25,000, without touching redundancy or the QA structure. The technique and its trade-offs for one modality are covered in our guide to model-assisted labeling for images; the budget logic is the same for text.
The saving is real but bounded, and the bounds matter for a defensible estimate. Sheng et al. (2008) and Snow et al. (2008) both show that model-assisted and crowd labels still need human checks where the model is uncertain, so you cannot cut redundancy to one and call it ground truth.
Pre-labeling also introduces automation bias—the tendency for a reviewer to rubber-stamp a confident but wrong suggestion—which can quietly lower quality while appearing to raise throughput. Treat AI pre-labeling as a multiplier on the time term, keep the reliability plan intact, and re-measure agreement after you turn it on.
What the calculator will not tell you
The arithmetic is honest about scope and blind to a few things that decide whether the project succeeds, so hold the number loosely. It cannot price the cost of a broken codebook discovered late.
Sambasivan et al. (2021) documented this as data cascades: small, neglected upstream data problems that stay invisible until they surface as expensive downstream failures, reported by 92% of the AI practitioners they studied. A vague guideline that makes 2,000 items get labeled the wrong way is not a line in the budget—it is a relabel of the whole corpus.
That is why the fixed setup cost, the smallest dollar figure in the worked example, is the one to protect. Running a pilot annotation round before you scale is where you discover that your real time-per-item is 15 minutes not 10, that one scale item drives half your disagreements, and that your QA overhead should be 35% not 25%. The pilot does not just de-risk the project; it replaces the guesses in your calculator with measurements, which is the difference between a budget and a hope.
Where Tagaroo fits
The inputs this calculator needs—time-per-item, disagreement rate, the redundancy your reliability target requires—are exactly the numbers a pilot produces, and they are what Tagaroo is built to surface. Curated scales load as pre-written, anchored codebooks, so annotators start from a mature instrument rather than a blank manual, which is the single fastest way to pull down both time-per-item and the disagreement rate that inflates QA. Inter-rater reliability is computed as coders work, so the redundancy and adjudication terms in your budget are grounded in measured agreement rather than assumption.
The practical upshot: estimate the budget from Items × Labels-per-item × Time-per-item × Loaded-wage, add QA and a fixed setup cost, and convert to a timeline through realistic headcount—then run a pilot to replace every assumption in that formula with a measurement before you commit the full spend. A calculator is only as honest as its inputs, and the pilot is where the inputs become honest. If you try Tagaroo on your own data, annotations stay scoped to your project and are never used to train shared models; see our privacy policy for specifics.
References
- Hara K, Adams A, Milland K, Savage S, Callison-Burch C, Bigham JP. A Data-Driven Analysis of Workers’ Earnings on Amazon Mechanical Turk. Proc CHI. 2018;1-14. DOI
- Snow R, O’Connor B, Jurafsky D, Ng A. Cheap and Fast – But is it Good? Evaluating Non-Expert Annotations for Natural Language Tasks. Proc EMNLP. 2008;254-263. ACL Anthology
- Sheng VS, Provost F, Ipeirotis PG. Get Another Label? Improving Data Quality and Data Mining Using Multiple, Noisy Labelers. Proc KDD. 2008;614-622. DOI
- Sambasivan N, Kapania S, Highfill H, Akrong D, Paritosh P, Aroyo LM. “Everyone wants to do the model work, not the data work”: Data Cascades in High-Stakes AI. Proc CHI. 2021;1-15. DOI
- Montgomery SA, Åsberg M. A new depression scale designed to be sensitive to change. Br J Psychiatry. 1979;134:382-389. DOI
- Andreasen NC. The Scale for the Assessment of Thought, Language, and Communication (TLC). Schizophr Bull. 1986;12(3):473-482. DOI
If your labeling problem is clinical language or structured text, Tagaroo turns curated schemes like the MADRS and the TLC into guided, reliability-tracked workflows so the numbers in your budget come from measurement, not guesswork.
Frequently asked questions
- How do you calculate the cost of a data annotation project?
- Multiply four numbers and add two, then check the result against calendar reality. The core formula is Items × Labels-per-item × Time-per-item × Loaded-hourly-wage, which gives your base labeling cost; then add a QA and adjudication overhead (a percentage of that base) and a fixed setup cost for the pilot, guidelines, and training. As a worked synthetic example, 2,000 transcripts × 3 labels each × 0.20 hours × $30/hour is 1,200 hours and $36,000 of labeling, plus 25% ($9,000) for QA and a $5,000 setup, for roughly $50,000. The single biggest lever is time-per-item, because it multiplies against every item and every redundant label.
- How much does data labeling cost per label?
- It spans several orders of magnitude, so a per-label figure only means something once you name the labeler and the task. At the cheap end, Snow et al. (2008) collected 7,000 non-expert Mechanical Turk annotations for US$2.00—about 3,500 crowd labels per dollar for a simple affect-recognition task. At the expensive end, a fully loaded clinical rater applying a structured scale to an interview transcript can cost several dollars per label, because each label takes minutes of trained attention rather than seconds. Published crowd figures anchor the floor; trained clinical annotation sits far above it, and vendor list prices vary widely and are best obtained by quote rather than assumed.
- How do you estimate the timeline for an annotation project?
- Convert total productive hours into calendar time using headcount, not wishful thinking. Calendar time ≈ Total productive hours ÷ (Headcount × Productive-hours-per-day), and productive hours per annotator per day are closer to 6 than 8 once breaks, ramp-up, and the vigilance limits of close reading are subtracted. In the synthetic 2,000-transcript example the 1,500 productive hours take about 13 weeks with four coders or about 6 weeks with eight, plus one to two weeks of setup that no amount of headcount removes. Timeline scales with people, but only until coordination and reviewer bandwidth become the bottleneck.
- How does redundancy affect the annotation budget?
- Redundancy—having more than one person label each item—multiplies the labeling cost directly, so it is the second-largest budget lever after time-per-item. Snow et al. (2008) found that averaging about four non-expert labels per item matched the quality of a single expert on an affect task, while expert clinical work more often uses two independent coders for a reliability check. Sheng et al. (2008) show that repeated labeling improves quality when labels are noisy, but that blanket redundancy is wasteful: labeling a carefully chosen set of uncertain items repeatedly beats labeling everything the same number of times. Budget for the redundancy your reliability target needs, not a round number.
- Does AI pre-labeling reduce annotation cost?
- It can lower the time-per-item term by turning annotation into review-and-correct, but it does not remove the need for human ground truth on the hard cases. In the synthetic example, dropping time-per-item from 12 to 5 minutes cuts the base labeling cost from $36,000 to $15,000 while the redundancy and QA structure stays intact. The saving is real but bounded: Sheng et al. (2008) and Snow et al. (2008) both show that model-assisted or crowd labels still need human checks where the model is uncertain, and pre-labeling adds an automation-bias risk that raters rubber-stamp a confident wrong suggestion. Treat AI pre-labeling as a time multiplier, not a replacement for the reliability plan.
Keep reading
 Annotation Operations & Ethics
How Many Annotators Per Item? Redundancy and the Cost Curve
How many annotators per item do you need? One label is risky. Compare majority vote, Dawid-Skene, and MACE, and see where extra labels stop paying off.
 Annotation Operations & Ethics
Does Pay Improve Annotation Quality? What Research Shows
Does pay improve annotation quality? Higher pay lifts speed, participation, and fairness—but rarely accuracy. See what really drives label quality.
 Methods & Frameworks
How to Run a Pilot Annotation Round Before You Scale
Run a pilot annotation round before you scale: scope, sample size, double-coding, measuring agreement, and revising the codebook. See the checklist.
Put this into practice
Tagaroo turns any rating scale or coding scheme into a guided annotation workflow—with inter-rater reliability computed as you go.