Sample Size for Inter-Rater Reliability: Subjects and Raters
Set the sample size for inter-rater reliability: how many subjects and raters pin kappa or an ICC to a target CI width. See the planning tables.
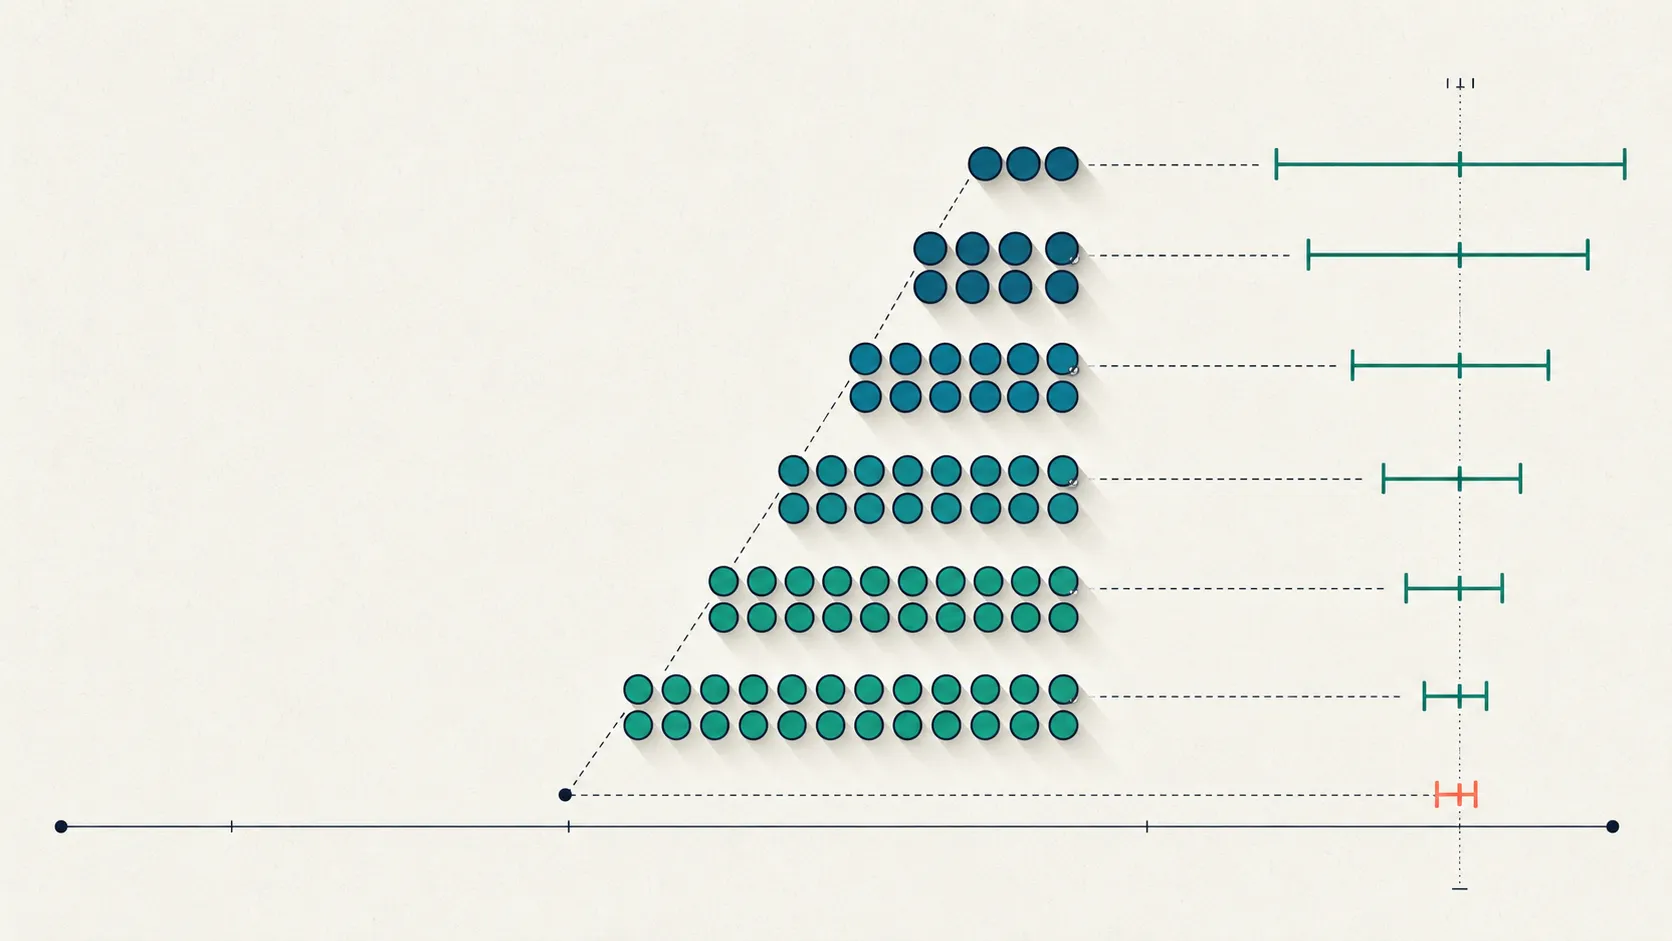
Ask how to set the sample size for inter-rater reliability and you usually get a shrug, a folk rule, or “about 30.” None of those is an answer. The real answer is a trade-off between how many subjects you recruit and how many raters score each one, tuned to the precision you actually want in the coefficient you will report (Kottner et al., 2011).
To pin an intraclass correlation of about 0.75 to a 95% confidence interval no wider than 0.20 with two raters, you need roughly 75 subjects; add a third rater and that falls to about 52 (Bonett, 2002). Change the target coefficient, the interval width, or the number of raters and the number moves by an order of magnitude—which is exactly why a single rule of thumb fails.
What determines the sample size for inter-rater reliability?
The sample size for inter-rater reliability is set by three inputs, in this order: the coefficient you will report, the precision you want expressed as a confidence-interval width, and the number of raters who score each subject. A fourth input, the base rate of the trait for categorical data, decides whether that plan survives contact with skew. Fix those and the number is close to mechanical; leave any of them vague and no calculator can help you (Kottner et al., 2011).
Each input pushes the number in a predictable direction. A more demanding target coefficient (say, proving reliability is at least 0.80 rather than 0.60) needs more subjects, and a tighter interval needs many more, because interval width shrinks with the square root of sample size, not linearly. More raters per subject, in turn, need fewer subjects.
The coefficient itself matters too: a kappa for categorical labels and an intraclass correlation for continuous scores are sized by different formulas and behave differently under the same data (Bonett, 2002; Sim & Wright, 2005). Before sizing anything, settle which inter-rater reliability coefficient you will report, because that choice drives every number that follows.
Why report a confidence interval, not just a point estimate?
Report the coefficient with a confidence interval because the point estimate alone hides how much sampling error it carries. Two studies can both report a kappa of 0.70 and deserve completely different trust: one computed from 25 subjects might carry a 95% interval spanning 0.45 to 0.95, while one from 250 subjects lands near 0.62 to 0.78. Same headline number, opposite conclusions about whether the raters are reliable.
The GRRAS reporting guideline is explicit that a reliability estimate should be accompanied by its confidence interval, so a reader can judge its precision rather than take a bare value on faith (Kottner et al., 2011). This is why sample-size planning for reliability is usually framed around interval width, not around a significance test: you decide in advance how narrow the interval must be to be useful, then solve for the subjects that deliver it (Sim & Wright, 2005). Everything that follows is a way to turn “how precise do I need to be?” into “how many subjects and raters is that?”
How many subjects to estimate an ICC to a target precision?
For a continuous or interval-scaled rating scored by k raters, Bonett (2002) gives a closed-form estimate of the number of subjects needed to hit a target 95% confidence-interval width. It is the workhorse formula for planning an intraclass correlation study, and it is simple enough to run on paper:
The formula makes the trade-offs concrete. Because w sits squared in the denominator, halving the interval width roughly quadruples the subjects. The table below runs Bonett’s formula for a planning ICC of 0.75—the low end of “good” reliability by common benchmarks (Koo & Li, 2016)—across three target widths and three rater counts. Read it as a starting point, not a verdict.
| Target 95% CI width | 2 raters | 3 raters | 5 raters |
|---|---|---|---|
| 0.10 (tight, ±0.05) | 296 | 202 | 155 |
| 0.20 (typical, ±0.10) | 75 | 52 | 40 |
| 0.30 (rough, ±0.15) | 34 | 24 | 19 |
The planning ICC swings these numbers hard. Drop the target to 0.60 and the two-rater, 0.20-width cell roughly doubles to about 159 subjects; raise it to 0.90 and the same cell falls to about 15 (Bonett, 2002). That sensitivity is the argument for computing your own number rather than copying a table: a guess about the ICC you expect quietly determines your recruitment target. For the deeper question of which ICC form matches your design, see our guide to choosing an ICC.
Zou (2012) extends Bonett’s precision approach by adding assurance—the probability that your study actually achieves the target width rather than getting unlucky—which nudges the count upward when you want near-certainty, not just an average.
How many raters versus how many subjects?
More raters per subject lower the number of subjects you need, but the saving shrinks fast and the total workload eventually grows. This is the subjects-times-raters trade-off at the heart of reliability-study design (Walter et al., 1998). Adding a second opinion to each subject buys a lot of precision; adding a fifth or sixth buys very little, because each subject’s score is already well estimated.
The table below holds the planning ICC at 0.75 and the target interval width at 0.20, and varies only the rater count. Watch the last column: the subjects fall, but the total ratings you must collect bottom out around two or three raters and then climb.
| Raters per subject (k) | Subjects needed | Total ratings collected |
|---|---|---|
| 2 | 75 | 150 |
| 3 | 52 | 156 |
| 4 | 44 | 176 |
| 5 | 40 | 200 |
The practical reading: if raters are scarce and subjects are cheap, use two or three raters and recruit more subjects. If subjects are scarce and expensive—common in clinical reliability work—more raters per subject partly compensate, which is the same logic behind deciding how many annotators a hard labeling task needs. Walter, Eliasziw and Donner (1998) formalize the cost-optimal balance; Shoukri, Asyali and Donner (2004) review and extend it. Neither supports the reflex of throwing a large panel at every subject.
How does the sample size for inter-rater reliability change for kappa?
For categorical labels scored by kappa, the sample size for inter-rater reliability is driven by the same precision logic but computed differently, and it is far more sensitive to the base rate of the categories. Kappa’s standard error depends on the number of subjects, the number of categories, and how the ratings are distributed across them, so a plan that works at a balanced 50/50 split can be badly undersized when one label dominates (Sim & Wright, 2005).
Bujang and Baharum (2017) tabulate minimum sample sizes for the kappa agreement test and find they range from a handful to nearly 700 subjects depending on the expected kappa and the marginal proportions. Their practical rule is worth carrying into any plan: when the true marginal rating frequencies are unequal, roughly double the estimated minimum sample size to stay adequately powered. They also warn that the naive formula can spit out an implausibly small number under favorable assumptions, so sanity-check any count below about 30. For the mechanics of the coefficient itself, see computing and interpreting Cohen’s kappa; for many raters or missing ratings, Krippendorff’s alpha is sized by the same width-first thinking.
How much does prevalence change the number you need?
Prevalence changes it a lot, and almost always in the direction of needing more subjects. As one category gets rare, kappa’s confidence interval widens for a fixed sample size, and the coefficient can read low even when raters agree on most items—the kappa paradox (Sim & Wright, 2005). Planning at a comfortable 50/50 split and then running on a trait that shows up nine times in ten is how a study ends up underpowered without anyone noticing until the interval comes back embarrassingly wide.
Two defenses go into the plan, not the write-up. First, size for the prevalence you actually expect: apply the roughly-double heuristic when marginals are lopsided (Bujang & Baharum, 2017). Second, decide in advance to report a prevalence-resistant coefficient such as Gwet’s AC1 next to kappa, so a skew-driven collapse is visible rather than mistaken for rater disagreement; our post on Gwet’s AC1 and the kappa paradox works through why. Clinician-rated ordinal scales are the canonical setting: the Montgomery-Åsberg Depression Rating Scale (MADRS) and Andreasen’s Scale for the Assessment of Thought, Language and Communication (TLC) produce graded per-item ratings whose base rates vary item by item, so the number of subjects that pins one item’s agreement may leave another’s interval too wide.
Precision or power? Two ways to size the study
There are two legitimate framings, and they answer different questions. The precision framing asks how many subjects pin the coefficient to a target confidence-interval width, and it is the one most reliability guidelines favor (Bonett, 2002; Kottner et al., 2011). The power framing asks how many subjects give a good chance of showing the coefficient exceeds some threshold—for example, that reliability is significantly above 0.60—and Walter, Eliasziw and Donner (1998) provide the design tables for it.
Use precision when your goal is to report a trustworthy estimate with an honest interval, which is most annotation and scale-validation work. Use power when a study must formally reject a null reliability value, common in regulated or confirmatory settings. Zou (2012) bridges the two by adding assurance to the precision approach, so you can plan for a stated probability of actually achieving your target width rather than hitting it only on average. Whichever framing you pick, state it in the methods so a reader knows what the number was designed to do.
A worked example: sizing a two-rater ICC study
Suppose you are validating a continuous transcript-derived score—say, a 0-to-40 severity total—and two trained raters will score every subject. You expect an intraclass correlation around 0.75 and you want a 95% interval no wider than 0.20, so a reader cannot dismiss the estimate as imprecise. Plugging ρ = 0.75, k = 2, and w = 0.20 into Bonett’s formula returns about 75 subjects (rounding up and including the author’s small-sample adjustment). Recruit 80 and you have a comfortable margin.
Now stress-test the plan. If a pilot suggests the true ICC is closer to 0.60, that same interval needs roughly 159 subjects—so run a pilot annotation round before you commit, because the planning ICC is a guess until you have data. If recruiting 80 subjects is infeasible, adding a third rater drops the requirement to about 52 while barely changing the total ratings collected. The example is synthetic, but the arithmetic is exactly what a reviewer will redo, so show your inputs—and you can run those numbers yourself for either kappa or an ICC, with the precision trade-off curve drawn alongside.
Rules of thumb, and why to compute your own number
Rules of thumb are fine as a first sniff and dangerous as a final answer. The honest defaults: aim for a 95% interval no wider than about 0.20 for a “good” reliability claim; expect 2 to 3 raters per subject to be efficient; and treat 30 subjects as a pilot floor, not a study target (Bonett, 2002; Walter et al., 1998).
- Fix the target interval width first, then solve for subjects—not the reverse (Kottner et al., 2011).
- Use two or three raters unless subjects are scarce; large panels waste effort (Shoukri et al., 2004).
- Double the count for kappa when prevalence is skewed, and report a prevalence-resistant coefficient alongside it (Sim & Wright, 2005; Bujang & Baharum, 2017).
- Pilot to get a defensible planning value for the ICC or kappa; the guess drives everything.
- Report the interval, never a bare estimate, and state which coefficient and framing you sized for (Kottner et al., 2011).
Sizing your inter-rater reliability study
The sample size for inter-rater reliability is not a lookup value; it is the output of three decisions you have to make on purpose—the coefficient, the interval width, and the rater count—plus a fourth check on prevalence for categorical data. Make those decisions explicit, run Bonett’s formula for an ICC or Bujang and Baharum’s tables for kappa, adjust for skew, and you get a number you can defend to a reviewer instead of a folk rule you cannot.
In Tagaroo, each coding scheme runs as a live annotation workflow, and inter-rater reliability is computed with its confidence interval as coders work, so the precision you planned for is the precision you can watch accumulate. Decide how narrow the interval must be, size the study to deliver it, and report the interval next to the estimate: that is the difference between a reliability number and a reliability claim.
References
- Walter, S. D., Eliasziw, M., & Donner, A. (1998). Sample size and optimal designs for reliability studies. Statistics in Medicine, 17(1), 101–110. Statistics in Medicine (Wiley)
- Bonett, D. G. (2002). Sample size requirements for estimating intraclass correlations with desired precision. Statistics in Medicine, 21(9), 1331–1335. doi.org/10.1002/sim.1108
- Zou, G. Y. (2012). Sample size formulas for estimating intraclass correlation coefficients with precision and assurance. Statistics in Medicine, 31(29), 3972–3981. doi.org/10.1002/sim.5466
- Shoukri, M. M., Asyali, M. H., & Donner, A. (2004). Sample size requirements for the design of reliability study: review and new results. Statistical Methods in Medical Research, 13(4), 251–271. doi.org/10.1191/0962280204sm365ra
- Sim, J., & Wright, C. C. (2005). The kappa statistic in reliability studies: use, interpretation, and sample size requirements. Physical Therapy, 85(3), 257–268. doi.org/10.1093/ptj/85.3.257
- Bujang, M. A., & Baharum, N. (2017). Guidelines of the minimum sample size requirements for Kappa agreement test. Epidemiology, Biostatistics, and Public Health, 14(2), e12267. doi.org/10.2427/12267
- Kottner, J., Audigé, L., Brorson, S., Donner, A., Gajewski, B. J., Hróbjartsson, A., Roberts, C., Shoukri, M., & Streiner, D. L. (2011). Guidelines for Reporting Reliability and Agreement Studies (GRRAS) were proposed. Journal of Clinical Epidemiology, 64(1), 96–106. doi.org/10.1016/j.jclinepi.2010.03.002
- Koo, T. K., & Li, M. Y. (2016). A guideline of selecting and reporting intraclass correlation coefficients for reliability research. Journal of Chiropractic Medicine, 15(2), 155–163. doi.org/10.1016/j.jcm.2016.02.012
- Landis, J. R., & Koch, G. G. (1977). The measurement of observer agreement for categorical data. Biometrics, 33(1), 159–174. doi.org/10.2307/2529310
Frequently asked questions
- How many subjects do I need for an inter-rater reliability study?
- It depends on three things, not one rule: the coefficient you will report, how tight a confidence interval you want, and how many raters score each subject (Kottner et al., 2011). As a worked anchor, estimating an intraclass correlation of about 0.85 with four raters to a 95% confidence interval of width 0.20 needs roughly 20 subjects (Bonett, 2002). Loosen the target coefficient toward 0.60 or tighten the interval toward 0.10 and the requirement climbs into the hundreds, so a number quoted without those three inputs is not a real answer.
- Is 30 subjects enough for a reliability study?
- Sometimes, and often not. Thirty can suffice for a rough intraclass correlation when several raters score each subject and you accept a wide interval, but it is usually too few to pin a kappa with a skewed base rate to a narrow interval (Bonett, 2002; Bujang & Baharum, 2017). Treat 30 as a floor for a pilot, not a target for the main study, and compute the number your own coefficient and precision require.
- How many raters should score each subject?
- Two or three per subject is usually the efficient choice. Adding raters lowers the number of subjects you need, but with diminishing returns: past about three raters the total number of ratings you must collect starts rising faster than precision improves (Walter et al., 1998; Shoukri et al., 2004). The cost-optimal design balances the two, which is why reliability studies rarely use large rater panels (Bonett, 2002).
- Why report a confidence interval instead of just the kappa or ICC value?
- A single point estimate hides sampling error, so two studies reporting the same kappa of 0.70 can carry completely different weight if one has 25 subjects and the other has 250. The GRRAS reporting guideline recommends stating the coefficient with its confidence interval precisely so a reader can judge that precision (Kottner et al., 2011). Sizing a study to a target interval width, rather than to a bare estimate, is what makes the resulting number interpretable (Sim & Wright, 2005).
- Does prevalence affect the sample size I need for kappa?
- Yes. When one category dominates the ratings, kappa's confidence interval widens and the coefficient can collapse even at high raw agreement, the well-known kappa paradox (Sim & Wright, 2005). Bujang and Baharum (2017) advise roughly doubling the estimated minimum sample size when the marginal rating frequencies are unequal, and reporting Gwet's AC1 alongside kappa makes the prevalence effect visible rather than hidden.
Keep reading
 Reliability & Agreement
Which Inter-Rater Reliability Coefficient Should You Use?
Which inter-rater reliability coefficient to use, by data type, rater count, and missing data—a decision guide to kappa, alpha, AC1, and ICC.
 Reliability & Agreement
Cohen's Kappa: How to Compute and Interpret Agreement
How to compute Cohen's kappa and weighted kappa by hand, read the result honestly, and know when to use Krippendorff's alpha, ICC, or Gwet's AC1 instead.
 Methods & Frameworks
How to Run a Pilot Annotation Round Before You Scale
Run a pilot annotation round before you scale: scope, sample size, double-coding, measuring agreement, and revising the codebook. See the checklist.
Put this into practice
Tagaroo turns any rating scale or coding scheme into a guided annotation workflow—with inter-rater reliability computed as you go.