Thematic Saturation: How Many Interviews Are Enough?
How many interviews reach thematic saturation: 9–17 in empirical tests, and how to assess it in your own coding with the Guest (2020) method. Run it.
“Data were collected until thematic saturation was reached” is the most common unsupported sentence in qualitative methods sections. The empirical answer to how many interviews it takes is narrower than the folklore suggests: studies that actually measured it reached saturation within 9 to 17 interviews or 4 to 8 focus groups, almost always in homogeneous samples with a tight research question (Hennink & Kaiser, 2022). The useful part is not the number.
It is that saturation can be assessed in your own coding, with a base size, a run length and a threshold, and reported in a way another researcher can reproduce (Guest, Namey & Chen, 2020). This guide gives the benchmark, the method, a worked example you can rerun in our thematic saturation calculator, and the paragraph to put in the paper.
How many interviews does thematic saturation take?
Thematic saturation takes 9 to 17 individual interviews or 4 to 8 focus groups in the studies that measured it empirically, and that range holds mainly for homogeneous populations with narrowly defined objectives (Hennink & Kaiser, 2022). The systematic review behind that figure screened four databases, found 23 studies that assessed saturation with empirical data or statistical modeling, and reported that the 17 empirical ones “reached saturation within a narrow range of interviews (9–17) or focus group discussions (4–8).” The outliers were predictable: multi-country research, meta-themes across sites, and studies that demanded saturation of a code’s meaning rather than its presence all needed more.
The number that started this literature is older. Guest, Bunce and Johnson (2006) coded 60 interviews with women in Ghana and Nigeria and tracked when codes appeared. Saturation occurred within the first 12 interviews, and the basic elements of the metathemes were present as early as 6. That paper is why “twelve interviews” became a rule of thumb; it is also why the rule misleads, because it came from one homogeneous sample and one tightly scoped question.
So the honest answer to “how many interviews for thematic saturation” is a benchmark plus a condition. Plan on the empirical range if your sample is homogeneous and your aim is narrow. Plan higher, and say why, if your participants vary, your sites differ, or your analysis needs to understand each theme rather than list it. Then assess saturation in the data you actually collect, because the planning number is a forecast and the assessed number is the evidence.
What is thematic saturation, and what is it not?
Thematic saturation is the point in data collection at which further interviews stop producing new themes or codes, so that collecting more would add volume without adding information. The definition sounds operational, but it hides a split that Hennink, Kaiser and Marconi (2017) made explicit: code saturation is when no new codes are being created, and meaning saturation is when you fully understand the codes you have, including their dimensions and variations.
Hennink, Kaiser and Marconi’s (2017) numbers show why the split matters: in a set of 25 in-depth interviews, code saturation was reached at interview 9, while meaning saturation for the conceptual codes took 16 to 24 interviews.
Hennink, Kaiser and Marconi (2017) put it this way: code saturation may indicate when researchers have “heard it all,” but meaning saturation is needed to “understand it all” (Hennink, Kaiser & Marconi, 2017).
A study that stops at 9 interviews can name every theme in its codebook and still describe the hardest ones thinly.
Saturation only makes sense for analyses where a stable set of codes is applied across interviews, which is to say codebook and coding-reliability approaches. Braun and Clarke (2021) argue that reflexive thematic analysis, where themes are generated through interpretation rather than found in the data, is not compatible with the concept at all. In their words, judgments about how many data items are enough are “inescapably situated and subjective.”
If your methods section says reflexive TA and then claims saturation, a methods-literate reviewer will notice the contradiction. The schemes where saturation is most measurable are the ones with explicit, enumerable codes: a narrative-structure scheme such as Labov and Waletzky’s clause types applied across interviews, or a Searle speech-act taxonomy coded on every turn.
How do you assess thematic saturation in your own data?
The most widely used method for assessing thematic saturation is the one Guest, Namey and Chen (2020) published in PLOS ONE: fix a base size, a run length and a new-information threshold, then compare each run of interviews against the base. The base size is the number of initial interviews whose unique themes become the denominator; the authors tested 4, 5 and 6. The run length is the number of subsequent interviews in which you count new themes; the options are 2 or 3, and successive runs overlap, shifting forward by one interview. The threshold is the proportion of new information you accept as evidence of saturation, either ≤5% or 0%.
The arithmetic is a ratio. New themes in the run divided by unique themes in the base gives the share of new information that run contributed. When a run’s ratio falls to the threshold, saturation is reported at the interview before that run, with the run length as a superscript.
The notation 6⁺² therefore means saturation at interview 6, confirmed by the two interviews that followed, eight interviews in total. The superscript is the part most people drop and the part that makes the claim checkable.
What does a worked saturation calculation look like?
In Guest, Namey and Chen’s (2020) worked example, a base of 4 interviews and a run of 2 give the following result, using hypothetical theme counts. The first four interviews yielded 37 unique themes. Interviews 5 and 6 added 7 new themes, a ratio of 19%. Interviews 6 and 7 added 4, or 11%.
Interviews 7 and 8 added 1, about 3%, which clears the ≤5% threshold, so saturation is reported as 6⁺². On the stricter 0% threshold the same dataset reached saturation at 10⁺² (Guest, Namey & Chen, 2020). The per-interview counts behind those runs are 4, 3, 1 and 0 new themes in interviews 5 through 8.
New themes per interview after a base of four interviews holding 37 themes, from the worked example in Guest, Namey and Chen (2020). The overlapping two-interview runs contribute 19%, 11% and then about 3% new information, so saturation is reported at 6⁺² on the ≤5% threshold and would be 10⁺² at 0%.
Does interview order change the result?
Yes: the Guest, Namey and Chen (2020) saturation point depends on the order in which interviews are analyzed, so a different order can move it by several interviews. The authors validated the approach by bootstrapping 10,000 random orderings of three real datasets of 40, 48 and 60 interviews; on the ≤5% threshold with a run of 2, the median saturation point was 6⁺² for the first two datasets and 8 to 9 for the third, with the 95th percentile at 9 to 10 interviews for the first two datasets and 13 to 16 for the third (Guest, Namey & Chen, 2020). A planner should remember both numbers: six interviews was the typical saturation point, but unlucky orderings in the third dataset needed up to 16.
Is thematic saturation the right justification for your sample size?
Thematic saturation is the right justification only after the data exist; before data collection, the defensible argument is information power, and for a prevalence-based question, the Fugard and Potts calculation. Malterud, Siersma and Guassora (2016) proposed information power precisely because saturation is tied to one methodology and applied inconsistently. Their principle fits in a sentence: the more information the sample holds that is relevant to the actual study, the lower the number of participants needed.
What is information power, and how is it rated?
Five dimensions set how much information power a planned sample has, and the model deliberately gives no formula. A narrow aim needs fewer participants than a broad one. A dense sample, whose participants hold highly specific experience of the phenomenon, needs fewer than a sparse one.
Analysis that applies established theory needs fewer than analysis that starts from nothing. Strong dialogue, focused and rich, needs fewer interviews than weak dialogue. And case-based analysis of a few participants in depth needs fewer than exploratory cross-case comparison (Malterud, Siersma & Guassora, 2016). Rating your design on each pole produces the justification paragraph; the number follows from the argument, not the reverse.
How does the Fugard and Potts prevalence calculation work?
Fugard and Potts (2015) offer the one genuinely quantitative planning tool, and it answers a narrower question: how many participants do you need to observe a theme of a given population prevalence at least k times with a given probability?
Fugard and Potts (2015) give a worked figure: 29 participants give 80% power to see two instances of a theme held by 10% of the population. The calculation assumes something close to random sampling, which most interview studies do not use, so the authors frame it as a thinking aid rather than a requirement. It is most useful when the thing you must not miss is a rare experience.
| Approach | When it applies | What it outputs | Main limitation |
|---|---|---|---|
| Guest, Bunce & Johnson (2006) | After the fact; one homogeneous 60-interview study | Saturation within 12 interviews; metathemes present by 6 | A single sample, often misread as a universal rule |
| Hennink, Kaiser & Marconi (2017) | Codebook analyses that need depth, not just a code list | Code saturation at 9; meaning saturation at 16–24 of 25 interviews | Stopping at code saturation leaves conceptual codes thin |
| Guest, Namey & Chen (2020) | During or after analysis, any codebook-style coding | A reproducible saturation point in n⁺run notation, e.g. 6⁺² | Depends on interview order; bootstrap it |
| Malterud et al. (2016) information power | Before data collection; any interview design, including reflexive TA | A structured justification across five dimensions, no number | Qualitative judgment; no formula to cite |
| Fugard & Potts (2015) | Before data collection, when a rare theme must not be missed | The n to see a theme of prevalence p at least k times with power 1-β | Assumes random sampling |
The practical pairing is one planning argument and one assessment. Use information power, with Hennink and Kaiser’s range as the external benchmark, to justify the number in the protocol and the ethics application. Then use the Guest, Namey and Chen method on the coded data to report where saturation actually fell. A protocol that promises 12 interviews and a results section that reports 6⁺² with a 1,000-order robustness check is a study nobody can accuse of asserting saturation.
What should the methods section say about thematic saturation?
A methods section should state the planning rationale, the assessment method with its three parameters, the saturation point in n⁺run notation, and the order-sensitivity check, in that order. Each element answers a question a reviewer would otherwise ask. Here is a paragraph to adapt, with synthetic numbers:
Three reporting habits make that paragraph defensible rather than decorative. Name the parameters, because 6⁺² at ≤5% and 10⁺² at 0% describe the same data and a reader must know which you chose. Report the robustness check, because the method’s order dependence is public knowledge and a reviewer who has read the 2020 paper will ask.
And keep the planning rationale separate from the assessment, so the protocol number and the observed number can disagree without the paper looking inconsistent. If your journal asks for a COREQ or SRQR checklist, the sample-size item is where this paragraph gets cited; our checklist builder finds the passage for you.
This is the same discipline that applies to reliability reporting, where a bare kappa is as unhelpful as a bare “saturation was reached.” The inter-rater reliability methods template uses the identical structure: coefficient, parameters, estimate, uncertainty. And if a second coder is part of the design, the question of how many annotators each transcript needs is the reliability-side twin of the saturation question.
Where thematic saturation breaks down
Thematic saturation breaks down in four situations, and each has a different fix. The first is heterogeneous or multi-site samples. Hennink and Kaiser (2022) found their 9 to 17 range in homogeneous populations; the studies chasing meta-themes across countries needed larger samples, and no single saturation point describes a sample that contains several populations. The fix is to assess saturation within each stratum, or to plan the sample from information power with the sparse-sample pole acknowledged.
The second is confusing code saturation with meaning saturation. A codebook that stops growing at interview 9 is evidence that you have heard the range of issues, not that you understand each one, and the gap can be 7 to 15 further interviews (Hennink, Kaiser & Marconi, 2017). If the conceptual codes carry the paper’s argument, keep collecting after code saturation and say that you did, as the paragraph above does.
The third is analysis order. The 2020 method counts new themes in the order interviews are analyzed, and a different order can move the result by several interviews. The authors’ bootstrap and the calculator’s 1,000-order rerun both exist to put a number on that sensitivity; report it rather than hoping nobody asks.
The fourth is methodological mismatch. Saturation presupposes that themes are in the data waiting to be found. Reflexive thematic analysis rejects that premise, and Braun and Clarke (2021) are explicit that saturation “experiments” rest on assumptions their approach does not share.
The fix is not to compute a saturation point anyway; it is to justify the sample on information power and the depth the question requires, and to describe the stopping decision as a situated judgment. Sample-size logic in reliability studies has the same shape: the sample size for an inter-rater reliability study follows from the precision you want, not from a folk number, and the honest report shows the inputs.
How should thematic saturation be reported?
The practical upshot: plan the sample with information power and the 9 to 17 benchmark, assess thematic saturation in the coded data with a stated base, run and threshold, report it as n⁺run with an order-robustness check, and keep going past code saturation when the conceptual codes need it. That turns the most common unsupported sentence in qualitative methods into one of the most verifiable.
The assessment is a few minutes of arithmetic once your coding records which interview each theme first appeared in. Paste counts or a theme-by-interview matrix into the thematic saturation calculator and it returns the saturation point under all four reporting options, the discovery curve, the random-order check and a methods paragraph to adapt. For the coding itself, a shared codebook that every coder applies the same way is what makes the theme counts trustworthy in the first place; our guide to annotation guidelines that work covers how to write one.
References
- Guest, G., Bunce, A., & Johnson, L. (2006). How many interviews are enough? An experiment with data saturation and variability. Field Methods, 18(1), 59–82. doi.org/10.1177/1525822X05279903
- Hennink, M. M., Kaiser, B. N., & Marconi, V. C. (2017). Code saturation versus meaning saturation: How many interviews are enough? Qualitative Health Research, 27(4), 591–608. doi.org/10.1177/1049732316665344
- Guest, G., Namey, E., & Chen, M. (2020). A simple method to assess and report thematic saturation in qualitative research. PLOS ONE, 15(5), e0232076. doi.org/10.1371/journal.pone.0232076
- Malterud, K., Siersma, V. D., & Guassora, A. D. (2016). Sample size in qualitative interview studies: Guided by information power. Qualitative Health Research, 26(13), 1753–1760. doi.org/10.1177/1049732315617444
- Hennink, M., & Kaiser, B. N. (2022). Sample sizes for saturation in qualitative research: A systematic review of empirical tests. Social Science & Medicine, 292, 114523. doi.org/10.1016/j.socscimed.2021.114523
- Fugard, A. J. B., & Potts, H. W. W. (2015). Supporting thinking on sample sizes for thematic analyses: A quantitative tool. International Journal of Social Research Methodology, 18(6), 669–684. doi.org/10.1080/13645579.2015.1005453
- Braun, V., & Clarke, V. (2021). To saturate or not to saturate? Questioning data saturation as a useful concept for thematic analysis and sample-size rationales. Qualitative Research in Sport, Exercise and Health, 13(2), 201–216. doi.org/10.1080/2159676X.2019.1704846
Frequently asked questions
- How many interviews do you need for thematic saturation?
- Empirical tests converge on a narrow range. Hennink and Kaiser's (2022) systematic review of 23 studies found that the 17 using empirical data reached saturation within 9 to 17 individual interviews or 4 to 8 focus groups, mostly in homogeneous samples with narrowly defined objectives. Guest, Bunce and Johnson (2006) saw saturation within their first 12 interviews, with the basic elements of metathemes present by 6. Heterogeneous samples, multi-site designs and a demand for meaning rather than code saturation all push the number up, so treat the range as a planning benchmark and assess saturation in your own data.
- What is the difference between code saturation and meaning saturation?
- Code saturation is the point at which no new codes are being created: you have heard the range of issues. Meaning saturation is the point at which you fully understand each code, including its dimensions and nuances. Hennink, Kaiser and Marconi (2017) found code saturation at 9 interviews in a set of 25, but meaning saturation took 16 to 24 interviews for the conceptual codes. A study that stops at code saturation can name every theme and still misunderstand half of them.
- How do you calculate thematic saturation with the Guest, Namey and Chen method?
- Count the unique themes in a base of your first interviews, usually 4 to 6. Then take the next run of 2 or 3 interviews, count the new themes they add, and divide by the base count: that ratio is the new information in the run. Slide the run forward one interview at a time until the ratio drops to your threshold, typically 5% or 0%. Saturation is reported at the interview before the confirming run, in n⁺run notation: 6⁺² means saturation at interview 6, confirmed by two more (Guest, Namey & Chen, 2020).
- What is information power in qualitative research?
- Information power is Malterud, Siersma and Guassora's (2016) alternative to saturation for justifying a qualitative sample size. The more information a sample holds that is relevant to the study aim, the fewer participants are needed. Five dimensions decide it: how narrow the aim is, how specific the sample is, whether established theory is applied, the quality of the dialogue, and whether the analysis is case-based or cross-case. The model provides no formula; it structures the argument you make for your number.
- Should I report saturation if I use reflexive thematic analysis?
- Braun and Clarke (2021) argue no. Saturation assumes themes are waiting in the data to be found, which fits coding-reliability and codebook approaches but conflicts with reflexive thematic analysis, where themes are generated through the researcher's interpretation. If you use reflexive TA, justify the sample with information power or with the depth your question needs, and say so. Saturation metrics belong to designs where a stable set of codes is applied across interviews.
Keep reading
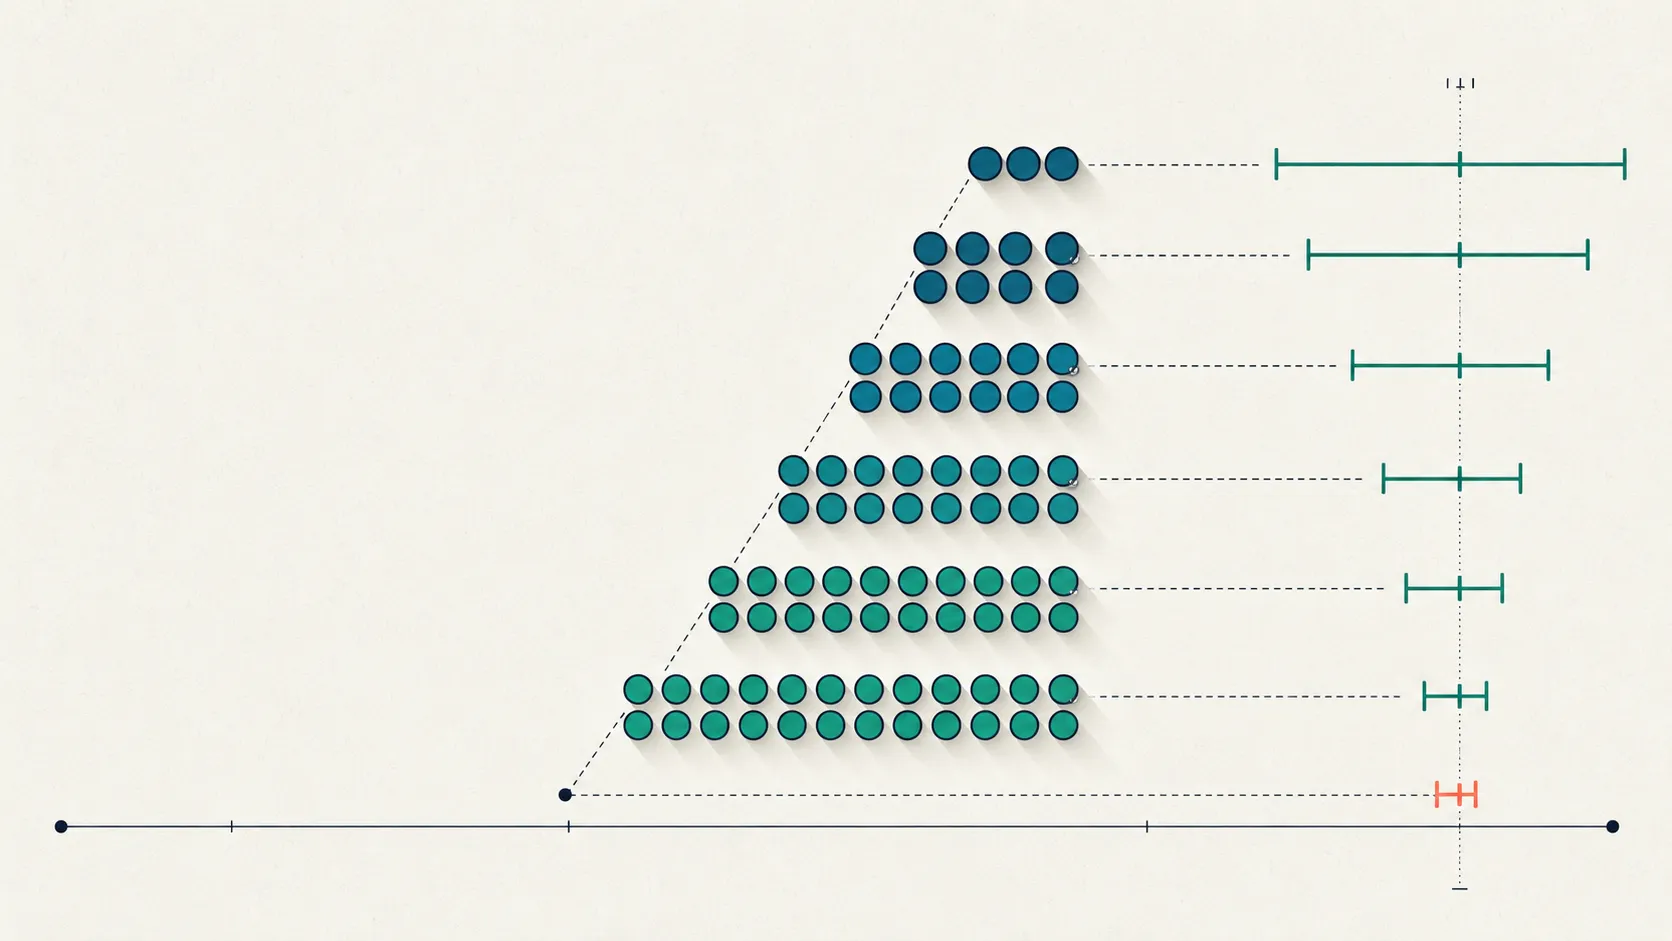 Reliability & Agreement
Sample Size for Inter-Rater Reliability: Subjects and Raters
Set the sample size for inter-rater reliability: how many subjects and raters pin kappa or an ICC to a target CI width. See the planning tables.
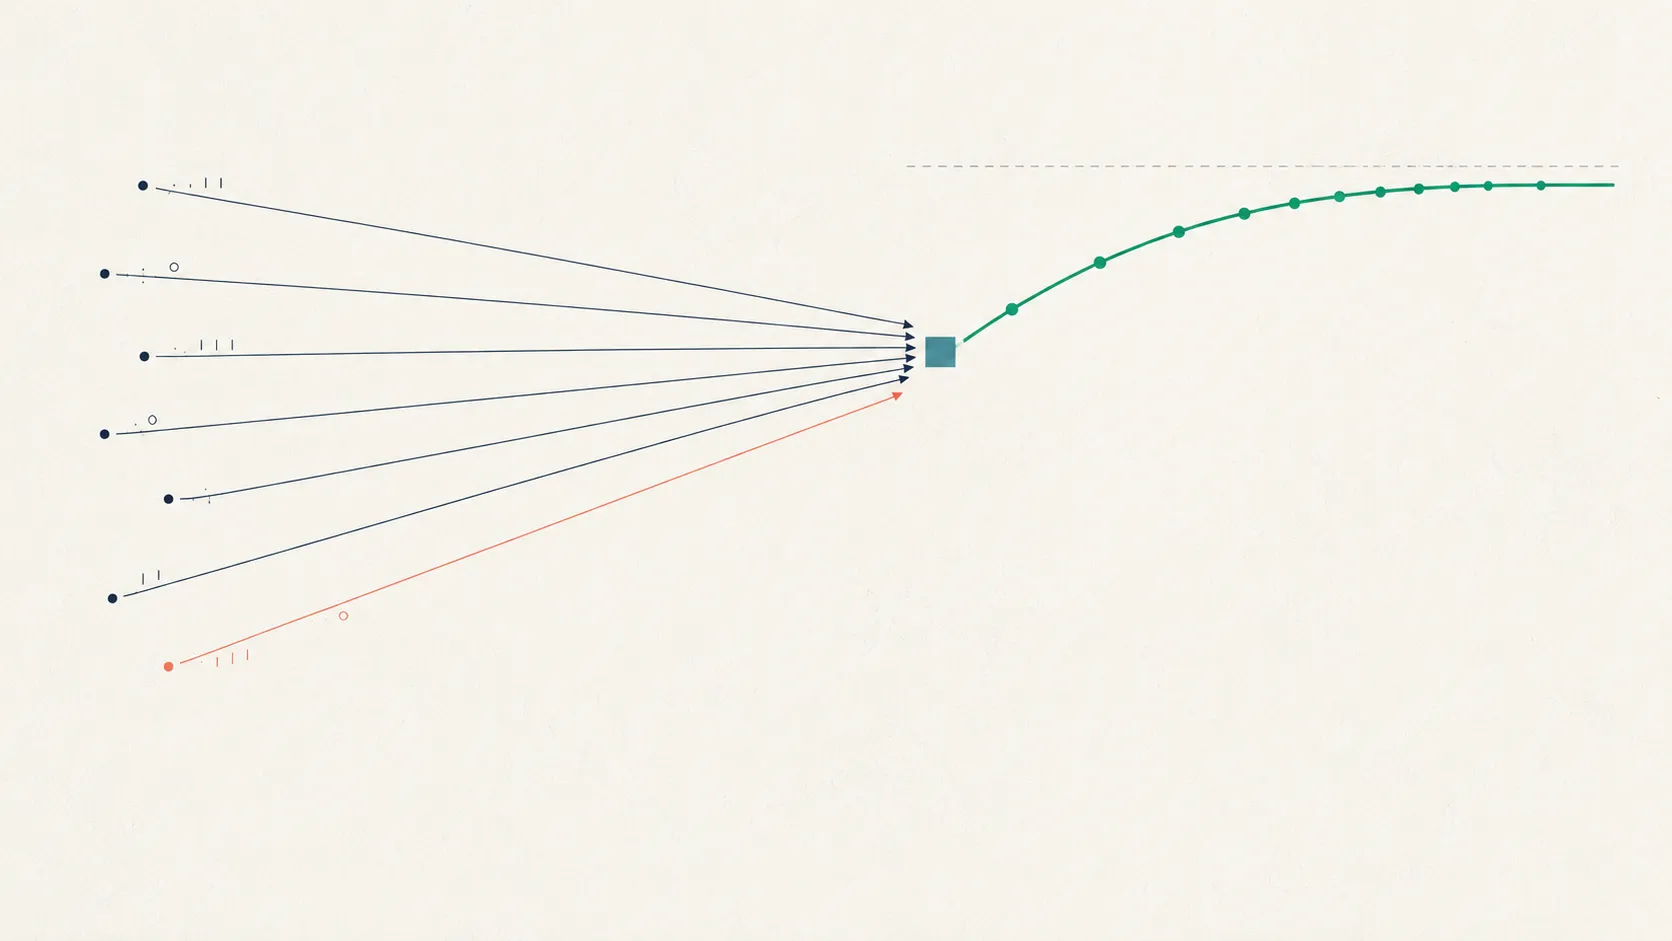 Annotation Operations & Ethics
How Many Annotators Per Item? Redundancy and the Cost Curve
How many annotators per item do you need? One label is risky. Compare majority vote, Dawid-Skene, and MACE, and see where extra labels stop paying off.
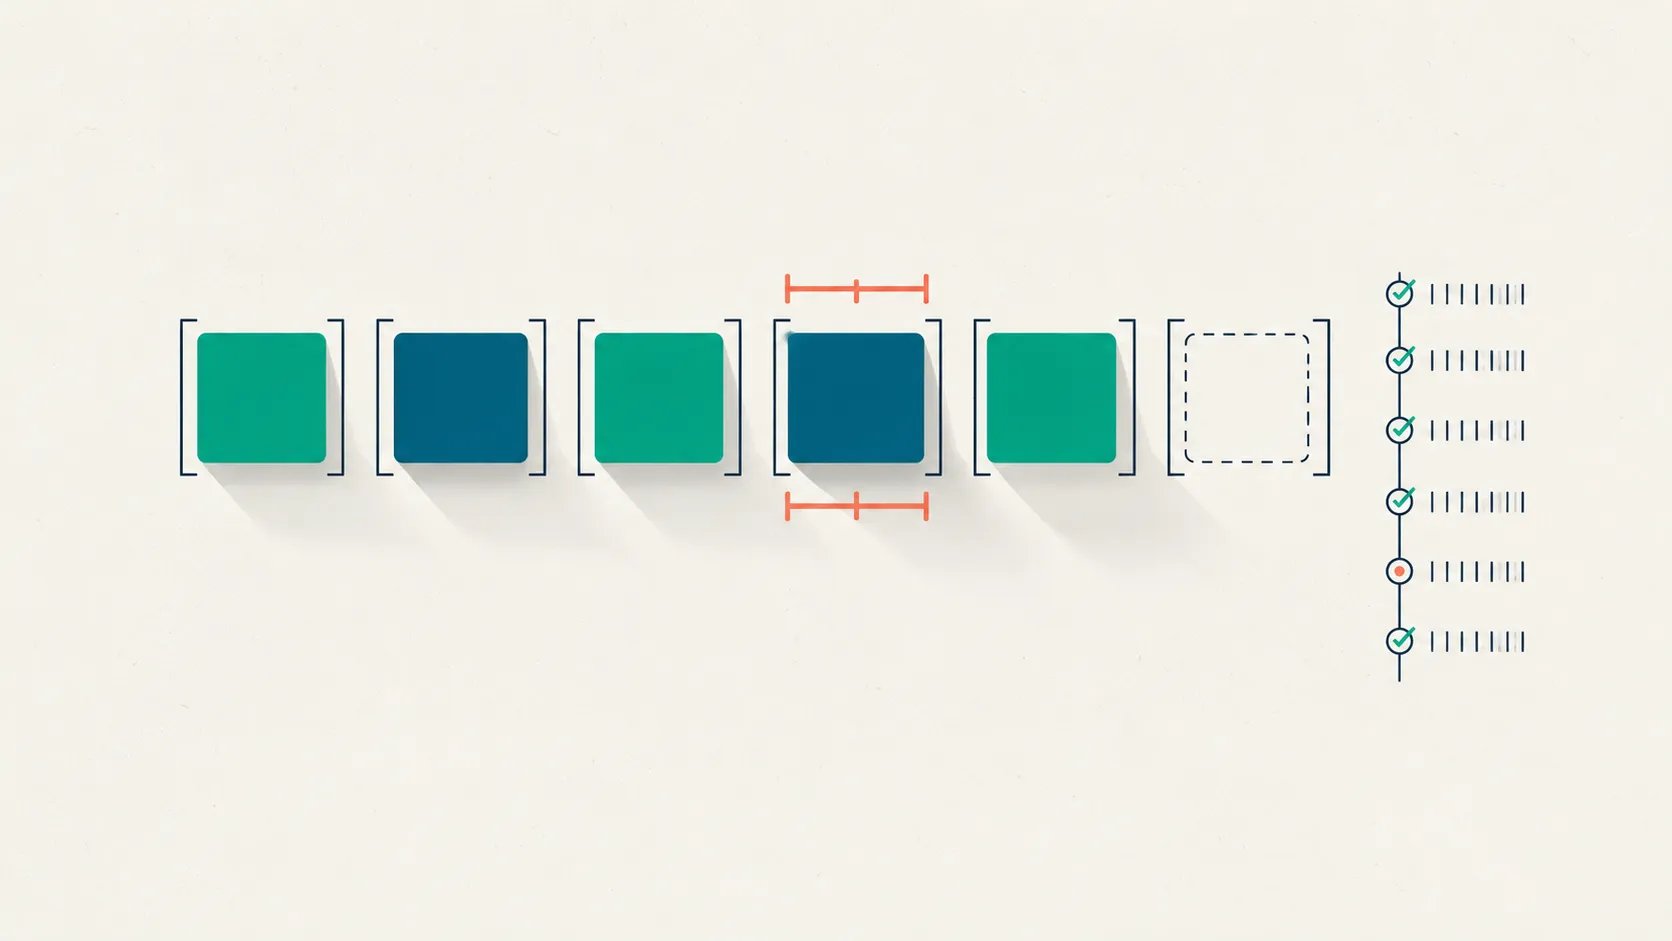 Reliability & Agreement
How to Report Inter-Rater Reliability: A Methods Template
A fill-in-the-blanks methods template for how to report inter-rater reliability: coefficient, raters, unit of analysis, CI, and software, per GRRAS.
Put this into practice
Tagaroo turns any rating scale or coding scheme into a guided annotation workflow—with inter-rater reliability computed as you go.