MADRS Explained: 10 Items, Scoring Bands & Remission
MADRS scoring explained: the 10 clinician-rated items, the 0-6 anchors, severity bands, and the response and remission cutoffs. See how it's coded.
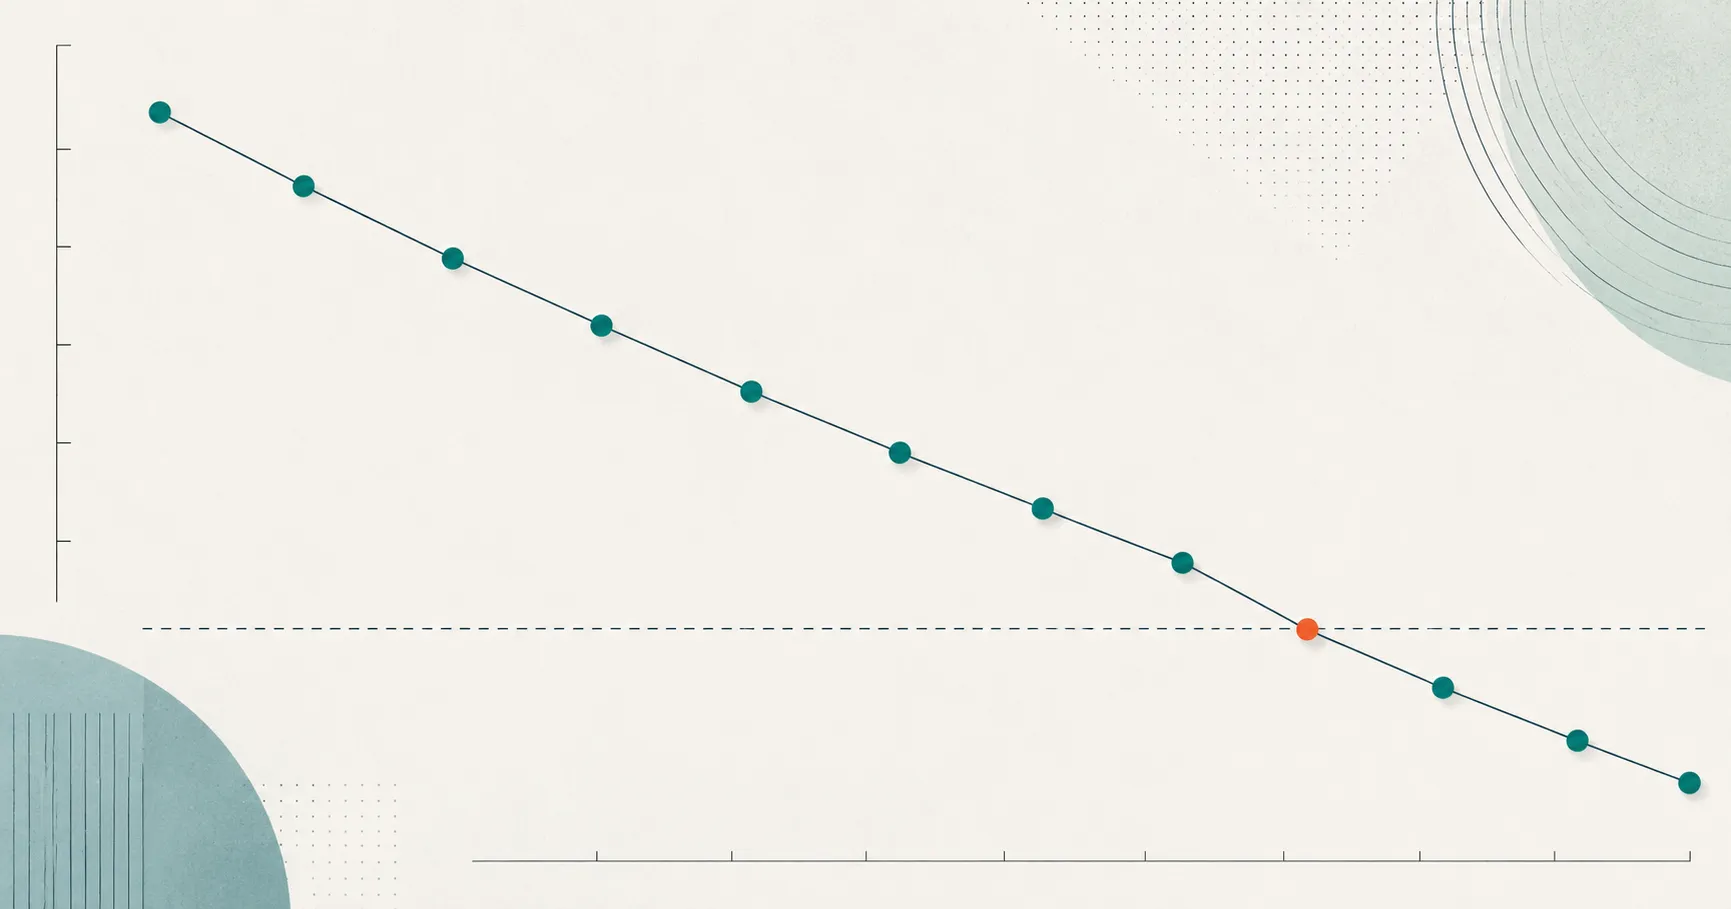
MADRS scoring comes down to ten clinician-rated items, each scored 0 to 6, summed into a total from 0 to 60 (Montgomery & Åsberg, 1979). What makes the scale worth knowing isn’t the arithmetic—it’s what it was built to do. The Montgomery-Åsberg Depression Rating Scale was designed to be sensitive to change, and in its 1979 derivation study it separated antidepressant responders from non-responders better than the older Hamilton scale. That single design choice is why the MADRS became the workhorse endpoint of modern antidepressant trials, and why a total of 10 or below is the number trialists watch for.
What is the MADRS?
The MADRS is a ten-item, clinician-rated scale for measuring the severity of depressive symptoms, built specifically to register change over the course of treatment (Montgomery & Åsberg, 1979). Stuart Montgomery and Marie Åsberg derived it by rating patients on a 65-item psychopathology scale, keeping the 17 symptoms most common in primary depression, and then narrowing to the 10 items that moved the most with antidepressant treatment.
That derivation is the whole point. Most depression scales aim to describe a cross-section of symptoms; the MADRS was engineered to detect the difference between before and after. It leans on the core psychological symptoms of depression—sadness, tension, loss of interest, pessimism—and deliberately under-weights the somatic items (sleep, appetite) that can double as drug side effects. You can see the full item set on the MADRS scale page.
How is the MADRS scored?
MADRS scoring sums the ten item ratings into a single total from 0 to 60. Each item runs from 0 to 6, with written anchors defined at the even points (0, 2, 4, 6) and the odd values (1, 3, 5) reserved for states that fall between them. There is no reverse-scoring and no weighting—every item contributes equally, and the total is just their sum.
Work a concrete (synthetic) example. A patient rated apparent sadness 4, reported sadness 4, inner tension 3, reduced sleep 2, reduced appetite 2, concentration 3, lassitude 3, inability to feel 3, pessimistic thoughts 2, and suicidal thoughts 0 scores a total of 26—squarely in the moderate band. The simulator below runs that arithmetic live, so you can watch each item move the total, the severity band, and the remission flag.
MADRS score simulator
Rate each item on the 0-6 MADRS anchors: 0 = symptom absent, 6 = most severe. Defined descriptions sit at 0, 2, 4, and 6; the odd values (1, 3, 5) mark intermediate states.
- 1.Apparent sadnessObserved dejection in voice, expression, and posture
- 2.Reported sadnessThe subject's own account of low mood
- 3.Inner tensionEdginess, ill-defined discomfort, dread, or panic
- 4.Reduced sleepReduced duration or depth vs. the subject's normal
- 5.Reduced appetiteLoss of appetite or of the pleasure of eating
- 6.Concentration difficultiesTrouble collecting or sustaining thoughts
- 7.LassitudeDifficulty starting and carrying out activities
- 8.Inability to feelReduced interest; loss of the capacity to feel
- 9.Pessimistic thoughtsGuilt, self-reproach, inferiority, remorse
- 10.Suicidal thoughtsLife not worth living; wishes for death
Total score
0 / 60
Severity band
Normal / symptom-free
Remission (<=10)
Yes
Item 10 flag
None
Severity bands follow Snaith et al. (1986); the remission target of a total of 10 or below follows Hawley et al. (2002). This tool illustrates how the MADRS is scored; it is an educational aid, not a diagnostic instrument, and a score is a measure of severity, not a diagnosis. Adjust the items above (or load the example) to see the score update.
One practical note on administration: the original 1979 paper published the scale without a set of interview questions, which left raters to improvise their probes. That gap was later closed by the Structured Interview Guide for the MADRS (SIGMA), which standardizes the questions for each item and pushed between-rater agreement on the total score to an intraclass correlation of 0.93 (Williams & Kobak, 2008). If two coders need to agree, a structured guide is doing most of the work.
What are the 10 MADRS items?
The ten MADRS items cover the core psychological symptoms of depression, with only two of the ten (sleep and appetite) touching the somatic domain. Nine are rated from what the patient reports; one—apparent sadness—is rated from observable dejection rather than self-report.
| # | MADRS item | What it captures |
|---|---|---|
| 1 | Apparent sadness (ASD) | Observable dejection in voice, expression, and posture, distinct from what the subject reports |
| 2 | Reported sadness (RSD) | The subject's own account of low mood, whether or not it shows outwardly |
| 3 | Inner tension (TEN) | Ill-defined discomfort, edginess, dread, or panic the subject cannot control |
| 4 | Reduced sleep (SLP) | Reduced duration or depth of sleep versus the subject's own normal |
| 5 | Reduced appetite (APP) | Loss of appetite or of the pleasure of eating |
| 6 | Concentration difficulties (CNC) | Difficulty collecting one's thoughts or following a train of thought |
| 7 | Lassitude (LAS) | Difficulty getting started or slowness carrying out everyday activities |
| 8 | Inability to feel (INF) | Reduced interest in surroundings; loss of the capacity to feel pleasure or emotion |
| 9 | Pessimistic thoughts (PES) | Guilt, inferiority, self-reproach, remorse, or thoughts of ruin |
| 10 | Suicidal thoughts (SUI) | Feeling life is not worth living; wishes for death or thoughts of suicide |
The lopsided ratio—eight psychological items to two somatic—is not an accident. It is the mechanism behind the scale’s headline property, and the reason a MADRS total tends to track mood rather than medication side effects.
What do MADRS scores mean? Severity bands
MADRS interpretation maps the 0–60 total onto four commonly used severity bands: 0–6 normal, 7–19 mild, 20–34 moderate, and 35–60 severe (Snaith, Harrop, Newby & Teale, 1986). The bands describe symptom burden; they are not themselves a diagnosis, and different sources draw the severe boundary slightly differently.
| MADRS total | Severity band | What it signals |
|---|---|---|
| 0–6 | Normal / symptom-free | At or below the remission range |
| 7–19 | Mild | Residual or mild active symptoms |
| 20–34 | Moderate | Substantial symptom burden |
| 35–60 | Severe | High symptom burden; close monitoring |
For tracking change, absolute band membership matters less than movement. A patient who drops from 32 to 14 has crossed from moderate to mild, but the clinically useful fact is the 18-point fall—which is where the scale’s design pays off.
What are the MADRS response and remission cutoffs?
Two thresholds carry most of the weight in trials: response, conventionally a ≥50% reduction from the baseline MADRS total, and remission, a total of 10 or below (Hawley, Gale & Sivakumaran, 2002). Response asks “did this person improve enough to matter?”; remission asks “are they essentially well?”
The remission cutoff has a solid empirical basis. Studying 684 depressed patients across 1,114 observations, Hawley and colleagues derived two candidate models and reported that “MADRS <10 should provide the clinician with a valid, and reasonably objectifiable, target for remission” (Hawley, Gale & Sivakumaran, 2002). In everyday use the operational remission cutoff is written as a total of 10 or below (≤10); Hawley’s model framed the same target as a score below 10, so the two describe essentially the same near-well patients. A stricter, near symptom-free reading of remission lands lower still—a MADRS of 4 or below in one analysis of 303 outpatients (Zimmerman, Posternak & Chelminski, 2004).
The takeaway for anyone reading a trial: check which cutoff was used before comparing remission rates. A study using ≤10 and one using ≤4 are counting different patients as “remitted,” and the gap between them is large enough to change a conclusion.
Is the MADRS more sensitive to change than the HAM-D?
The precise, citable claim is this: the MADRS was designed to be more sensitive to change than the Hamilton scale, and its own derivation study found that its “capacity to differentiate between responders and non-responders to antidepressant treatment was better than the [Hamilton Rating Scale], indicating greater sensitivity to change” (Montgomery & Åsberg, 1979). That result, in the original data, is real and is why the scale exists.
Here’s where the honest picture gets more nuanced. In independent head-to-head studies, the two scales perform closer to a tie: comparing them across the same patients, Khan and colleagues found treatment-effect sizes of 0.49 for the MADRS and 0.53 for the HAM-D, concluding the MADRS is “as sensitive an instrument as HAM-D” (Khan et al., 2002). The MADRS’s more defensible advantage is not a bigger effect size—it is that it under-weights somatic items, so its total is less contaminated by the sleep, appetite, and anxiety changes that antidepressants themselves produce.
| MADRS | HAM-D (17-item) | |
|---|---|---|
| Items | 10 | 17 |
| Rater | Clinician | Clinician |
| Score range | 0–60 | 0–52 |
| Original source | Montgomery & Åsberg, 1979 | Hamilton, 1960 |
| Somatic loading | Low (2 of 10 items) | Higher (several somatic/anxiety items) |
| Designed for | Detecting change with treatment | Describing symptom severity |
| Head-to-head effect size (Khan et al., 2002) | 0.49 | 0.53 |
Pick the instrument for the question. For a treatment-response study, the change-focused, mood-weighted MADRS is the natural endpoint; for continuity with decades of older trials, the Hamilton Depression Rating Scale (HAM-D) remains the legacy comparator. The two are covered head-to-head on the HAM-D scale page.
What is the MADRS-S, the self-rated version?
The MADRS-S is a nine-item, patient-completed self-report version of the scale (Svanborg & Åsberg, 1994). It drops the observer-rated apparent-sadness item—a patient cannot judge how sad they look to others—and rewords the remaining items as first-person questions the person answers directly.
It holds up well as a stand-in. In one clinical-practice evaluation of 63 outpatients, MADRS-S totals correlated with the clinician-rated MADRS at r = 0.81 and 0.91 across two assessments a month apart (Bondolfi et al., 2009)—close enough to make it a practical tool for frequent monitoring between clinician visits. The trade-off is the usual one for self-report: it captures the patient’s perspective rather than an interviewer’s structured judgment, so the two versions complement each other rather than being interchangeable. For a fully self-administered depression screen with a different lineage, compare the PHQ-9 scoring guide.
How do you score the MADRS from an interview transcript?
To score the MADRS from an interview, code the passage where the patient reports each symptom, then rate that evidence on the same 0–6 anchors—rather than filling a form from memory. This produces an auditable score: every one of the ten items points back to the exact words that justify it.
Consider a short synthetic exchange:
Interviewer: How have you been feeling about the future this past week?
Subject: Honestly, like there’s no point. I keep thinking my family would be better off without me around.
That reply supports coding item 10 (suicidal thoughts) well above zero, with the span “better off without me around” attached as the evidence—and, independent of the total, it flags a safety follow-up. Do this across the ten items and the total stops being a black box: a reviewer can check each rating against the transcript instead of trusting the sum. It also makes the Montgomery-Åsberg Depression Rating Scale reproducible enough to compute inter-rater reliability across coders, which the SIGMA structured guide is specifically designed to support (Williams & Kobak, 2008).
On data handling: transcript coding means working with sensitive language, so the sane default is de-identified text and a privacy-first setup. Tagaroo supports a browser-side anonymous mode, so transcript content can stay local rather than being uploaded—worth checking against your ethics approval before any real interview data touches a tool.
Common MADRS scoring mistakes
The most common MADRS scoring mistake is reading the total as a diagnosis, but a few others recur:
- Comparing remission rates across different cutoffs. A study using ≤10 and one using ≤4 count different patients as remitted (Hawley et al., 2002; Zimmerman et al., 2004). Always note the cutoff before comparing.
- Assuming a bigger effect size than the HAM-D. The MADRS was built to be change-sensitive, but head-to-head it performs comparably to the HAM-D, not dramatically better (Khan et al., 2002).
- Skipping a structured guide. Unstructured MADRS interviews drift; the SIGMA raised between-rater agreement on the total to an ICC of 0.93 (Williams & Kobak, 2008). If reliability matters, standardize the probes.
- Treating the MADRS-S and clinician MADRS as identical. They correlate strongly but measure from different vantage points (Svanborg & Åsberg, 1994)—don’t pool them in one change curve.
None of these are reasons to distrust the MADRS; it is well-validated and genuinely useful. They are reasons to report a MADRS score with its context: the cutoff, the version, item 10, and whether the number came from a structured interview or from evidence you can point to.
The practical upshot: MADRS scoring is simple arithmetic, but MADRS interpretation is where the judgment lives. Sum the ten items, respect the ≥50% response and ≤10 remission conventions for what they are, and never let the total obscure item 10.
References
- Montgomery, S. A., & Åsberg, M. (1979). A new depression scale designed to be sensitive to change. British Journal of Psychiatry, 134(4), 382–389. doi:10.1192/bjp.134.4.382
- Snaith, R. P., Harrop, F. M., Newby, D. A., & Teale, C. (1986). Grade scores of the Montgomery–Åsberg Depression and the Clinical Anxiety Scales. British Journal of Psychiatry, 148(5), 599–601. doi:10.1192/bjp.148.5.599
- Hawley, C. J., Gale, T. M., & Sivakumaran, T. (2002). Defining remission by cut off score on the MADRS: selecting the optimal value. Journal of Affective Disorders, 72(2), 177–184. doi:10.1016/S0165-0327(01)00451-7
- Zimmerman, M., Posternak, M. A., & Chelminski, I. (2004). Defining remission on the Montgomery-Asberg Depression Rating Scale. Journal of Clinical Psychiatry, 65(2). doi:10.4088/jcp.v65n0204
- Williams, J. B. W., & Kobak, K. A. (2008). Development and reliability of a structured interview guide for the Montgomery-Åsberg Depression Rating Scale (SIGMA). British Journal of Psychiatry, 192(1), 52–58. doi:10.1192/bjp.bp.106.032532
- Svanborg, P., & Åsberg, M. (1994). A new self-rating scale for depression and anxiety states based on the Comprehensive Psychopathological Rating Scale. Acta Psychiatrica Scandinavica, 89(1), 21–28. doi:10.1111/j.1600-0447.1994.tb01480.x
- Khan, A., Khan, S. R., Shankles, E. B., & Polissar, N. L. (2002). Relative sensitivity of the Montgomery-Asberg Depression Rating Scale, the Hamilton Depression rating scale and the Clinical Global Impressions rating scale in antidepressant clinical trials. International Clinical Psychopharmacology, 17(6), 281–285. doi:10.1097/00004850-200211000-00003
- Bondolfi, G., Jermann, F., Rouget, B. W., Gex-Fabry, M., McQuillan, A., Dupont-Willemin, A., et al. (2009). Self- and clinician-rated Montgomery-Åsberg Depression Rating Scale: evaluation in clinical practice. Journal of Affective Disorders, 121(3), 268–272. doi:10.1016/j.jad.2009.06.037
If you code depression symptoms from interviews or track MADRS change over time, Tagaroo turns the MADRS into a guided, evidence-anchored annotation workflow—with inter-rater reliability computed as your coders work.
Frequently asked questions
- What is a good MADRS score?
- A MADRS total of 0–6 is the normal, symptom-free band, and a total of 10 or below is the widely used target for remission in antidepressant trials (Hawley, Gale & Sivakumaran, 2002). The scale runs from 0 to 60, so a 'good' score means the low end of that range. The MADRS measures depressive severity—it is not itself a diagnosis.
- How is the MADRS scored?
- The MADRS is scored by summing ten clinician-rated items, each rated 0 to 6, for a total between 0 and 60 (Montgomery & Åsberg, 1979). There is no reverse-scoring and no item weighting—every item counts the same. Commonly used severity bands are 0–6 normal, 7–19 mild, 20–34 moderate, and 35–60 severe (Snaith, Harrop, Newby & Teale, 1986).
- What is the MADRS remission cutoff?
- The conventional MADRS remission cutoff is a total of 10 or below; two empirical models put the optimal value at under 9 and under 10 (Hawley, Gale & Sivakumaran, 2002). A stricter, near symptom-free definition puts remission at 4 or below (Zimmerman, Posternak & Chelminski, 2004). Treatment response, by contrast, is usually defined as a ≥50% reduction from the baseline total.
- Is the MADRS more sensitive to change than the HAM-D?
- The MADRS was designed to be sensitive to change, and its 1979 derivation study found it separated antidepressant responders from non-responders better than the Hamilton scale (Montgomery & Åsberg, 1979). In later head-to-head trials the two scales perform comparably (effect sizes 0.49 for the MADRS vs 0.53 for the HAM-D in Khan et al., 2002). The MADRS's clearer edge is conceptual: it under-weights somatic items, so it is less contaminated by antidepressant side effects.
- What is the MADRS-S?
- The MADRS-S is the nine-item, patient-completed self-report version of the scale (Svanborg & Åsberg, 1994). It drops the observer-rated apparent-sadness item—which a patient cannot judge from the outside—and correlates strongly with the clinician-rated MADRS (r = 0.81–0.91; Bondolfi et al., 2009). That makes it useful for frequent between-visit monitoring.
Keep reading
 Rating Scales
Auditable Clinical Ratings: Score From the Transcript
Build an auditable clinical rating by tying every scale item to a quoted line, not a global impression. See how span-grounded scoring works.
 Rating Scales
BPRS vs PANSS: The Two Standard Psychosis Rating Scales
BPRS vs PANSS compared: item overlap, the positive-negative-general structure, trial usage, and score linking. See which psychosis scale to use.
 Rating Scales
Depression Rating Scales Compared: HAM-D, MADRS, PHQ-9
Depression rating scales compared: HAM-D, MADRS, PHQ-9, and content analysis by rater, item count, and change-sensitivity. See which fits your study.
Put this into practice
Tagaroo turns any rating scale or coding scheme into a guided annotation workflow—with inter-rater reliability computed as you go.