Depression Rating Scales Compared: HAM-D, MADRS, PHQ-9
Depression rating scales compared: HAM-D, MADRS, PHQ-9, and content analysis by rater, item count, and change-sensitivity. See which fits your study.
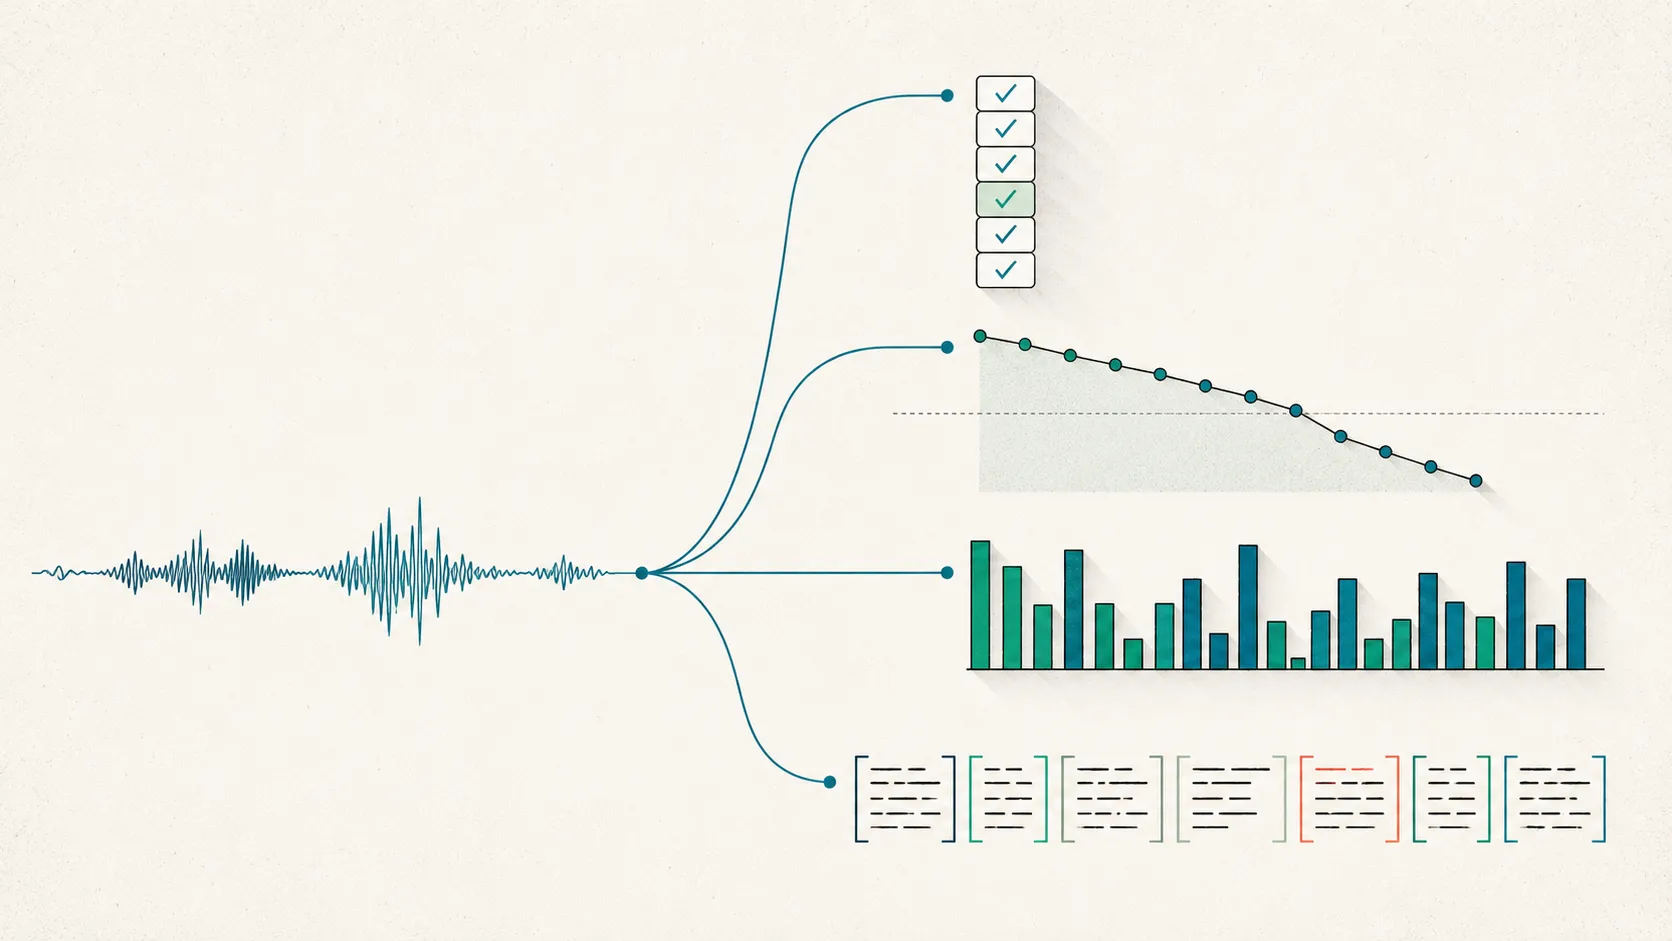
“Which depression rating scale should you use?” has no one-size answer, and pretending otherwise is how two studies measure the “same” thing and never line up. That is why it helps to see the main depression rating scales compared directly—the HAM-D, the MADRS, the PHQ-9, and Gottschalk-Gleser content analysis. The real choice resolves into four decisions: who does the rating, whether you need screening, severity, or change, how much time you have, and which slice of depression you actually care about.
Get those four right and the scale nearly picks itself. Get them wrong and you can rate the same patient on two scales and reach different conclusions—which, as the evidence below shows, happens more often than the field admits.
Depression rating scales compared: the four-way matrix
The four instruments below measure the same broad construct—depressive severity—but were built for different jobs, and those design choices decide which one fits your study. The matrix has the depression rating scales compared side by side on the axes that actually drive the decision: who rates them, how many items, how long they take, what job they do best, and how sensitive they are to change.
| Axis | PHQ-9 | MADRS | HAM-D (HDRS-17) | Gottschalk-Gleser |
|---|---|---|---|---|
| Rater | Self-report | Clinician | Clinician | Trained coder (from speech) |
| Items | 9 | 10 | 17 (scored) | 7 subscales, clause-level |
| Score range | 0–27 | 0–60 | 0–52 | Per-subscale magnitude scores |
| Time to administer | ~2–5 min | ~15–20 min | ~15–20 min | 5-min speech sample + intensive coding |
| Primary job | Screening + self-monitoring | Detecting change | Severity; legacy endpoint | Measuring affect in speech |
| Change-sensitivity | Moderate | High (by design) | High | Research use |
| Somatic loading | Moderate (DSM-mapped) | Low (2 of 10) | High (3 insomnia items) | One somatic subscale |
| Original source | Kroenke et al., 2001 | Montgomery & Åsberg, 1979 | Hamilton, 1960 | Gottschalk & Hoigaard-Martin, 1986 |
Each scale also has a full explainer of its own: the PHQ-9 scoring guide, the MADRS scoring guide, the Hamilton scale guide, and the Gottschalk-Gleser content-analysis guide. This page is the hub that decides between them.
Which “depression” is each scale measuring?
Each of these scales measures a slightly different depression, not the same one at different resolutions. When Eiko Fried disaggregated seven common depression scales into their component symptoms, the 125 items resolved into 52 distinct symptoms, and the content overlap between scales was weak—a mean Jaccard index of 0.36, where 1.0 would mean identical content (Fried, 2017).
The breakdown is stark. Of those 52 symptoms, 40% appear in only a single scale, and only one—sad mood—is captured specifically by every scale (Fried, 2017). The MADRS, deliberately lean and mood-focused, has one of the lowest content overlaps with the others (0.30), which is a feature of its design rather than a flaw.
This is the thesis that should govern every comparison that follows. Because the instruments sample different symptom sets, a treatment that moves one scale need not move another, and a finding obtained with one scale may not replicate with a second (Fried, 2017). “Depression severity” is not one quantity measured with error; it is several overlapping constructs wearing the same name. Choosing a scale is really choosing which depression you will see—which is why any honest look at the best depression scale research starts with content, not just reliability.
Clinician-rated or self-report? (axis 1: who does the rating)
The first fork is who assigns the score. The PHQ-9 is self-report—the patient rates themselves—while the HAM-D and MADRS are clinician-rated, scored by a trained interviewer from what the patient says and shows. Gottschalk-Gleser sits outside the split: it is neither, scoring a transcript of the patient’s own speech against defined categories.
The trade-off is real in both directions. Self-report is fast, cheap, scalable, and captures the patient’s inside view, but it is sensitive to insight, mood on the day, and response style. Clinician rating adds structured observation—the MADRS even reserves one item, apparent sadness, for dejection the interviewer sees rather than what the patient reports—at the cost of rater time and rater drift, where two clinicians score the same interview differently.
That difference shapes where each scale is used. In a review of 2,632 registered depression trials, clinician-administered scales dominated as inclusion and remission criteria in drug trials, while self-report questionnaires were primarily used in behavioral trials, and the gap widened over two decades (von Glischinski et al., 2021). The clinician-rated vs self-report depression question is covered in depth in our companion post on clinician-rated versus self-report scales; for the self-report end specifically, the PHQ-9 is the reference implementation.
Screening, severity, or change? (axis 2: the job the score does)
The second axis is what the number is for. The PHQ-9 is optimized to screen: at its conventional cutoff of ≥10 it caught major depression with a pooled sensitivity of 0.88 and specificity of 0.85 across 58 studies (Levis, Benedetti & Thombs, 2019). The HAM-D and MADRS are built to grade severity and, above all, to track change—the MADRS explicitly so, having kept the 10 symptoms that moved most with antidepressant treatment (Montgomery & Åsberg, 1979).
Between the two clinician scales, the change signal is closer than reputations suggest. Head-to-head, treatment effect sizes were 0.49 for the MADRS and 0.53 for the HAM-D (Khan et al., 2002), and across 161 comparisons in 80 trials neither scale was systematically more sensitive (Guizzaro et al., 2020). The honest caveat from that same analysis: the two are interchangeable in meta-analyses but the same trial can read differently on each, especially in small studies.
So when you pick a depression outcome measure, decide the job first. Screening routes to the PHQ-9; a clean change endpoint favors the MADRS; continuity with the vast older literature favors the HAM-D. We compare the two clinician scales in detail in MADRS vs HAM-D, and the full item sets live on the MADRS and Hamilton scale pages.
Brief or comprehensive? (axis 3: administration cost)
The third axis is time and training, and it separates the scales as cleanly as any psychometric property. The PHQ-9 is self-administered in roughly two to five minutes and needs no rater, which is why primary care leans on it. The MADRS and HAM-D each need a clinician interview of about fifteen to twenty minutes, plus the standardization that keeps raters aligned—structured guides such as the SIGMA for the MADRS and the SIGH-D for the HAM-D exist precisely to hold that reliability across interviewers (Williams, 1988; Williams & Kobak, 2008).
Gottschalk-Gleser is the most demanding of the four. It takes only a five-minute speech sample to collect, but the scoring is labor-intensive: trained coders are held to an inter-scorer reliability of 0.80 or better, and reaching that bar takes practice against previously scored samples (Gottschalk & Gleser, 1969). It buys something the checklists cannot—affect measured in the person’s own words—but it is a research instrument, not a bedside quick-screen.
Where does content analysis fit? (the qualitative outlier)
Gottschalk-Gleser content analysis is the outlier of the four: instead of a checklist filled in after an interview, it scores a transcript clause by clause across seven depressive subscales, weighting each clause by how strongly it signals the state (Gottschalk & Hoigaard-Martin, 1986). Where the PHQ-9, MADRS, and HAM-D produce one severity total, it produces a profile—hopelessness, self-accusation, psychomotor retardation, somatic concerns, death and mutilation, separation, and hostility outward—normalized for how much the person spoke.
That design makes it the qualitative counterweight in this comparison. It reads how someone talks about their distress rather than asking them to rate it, which is exactly what a symptom count throws away. It is closest in spirit to modern span-level text annotation, and it earns its place when the question is “what affect is in this speech,” not “how severe, on a fixed scale.” The full subscale structure is on the Gottschalk-Gleser depression scale page.
Which depression scale should you use?
Pick the instrument for the question, not its reputation. Choosing a depression scale comes down to matching one of four jobs to the tool built for it—the decision table below routes each goal to a scale and the reason behind it.
| If your goal is… | Use | Because |
|---|---|---|
| Screen for depression or self-monitor between visits | PHQ-9 | 9 self-report items; ≥10 is the validated positive-screen cutoff (Levis et al., 2019) |
| Detect treatment-related change in a trial | MADRS | 10 mood-weighted items built to be sensitive to change (Montgomery & Åsberg, 1979) |
| Stay comparable with decades of antidepressant data | HAM-D-17 | The legacy endpoint; older results are denominated in HAM-D points (Hamilton, 1960) |
| Measure affect in a person's own words | Gottschalk-Gleser | Weighted, clause-level content analysis of speech (Gottschalk & Hoigaard-Martin, 1986) |
Two routing notes keep this honest. First, the PHQ-9 vs HAMD choice is not self-report-versus-clinician alone—it is screening versus severity, and using a screen as a change endpoint (or a clinician severity scale as a mass screen) fights each tool’s design. Second, none of these totals convert one-to-one; when you must bridge scales, translate through percentage change from baseline rather than raw points, and never treat a MADRS total and a HAM-D total as the same currency.
How coding from a transcript unifies the four
Whichever scale you choose, the sane way to score it from a recorded interview is the same: code the passage where the subject reports each symptom, then rate that evidence on the scale’s own anchors, rather than filling a form from memory. This produces an auditable score—every rating points back to the exact words that justify it—and it is the workflow Tagaroo is built for.
Consider one short synthetic exchange, and watch how the same words feed different scales:
Interviewer: How have things been this past couple of weeks?
Subject: I can’t sleep, I’ve stopped bothering with anything, and honestly I keep thinking everyone would be better off without me.
On the PHQ-9, that reply loads the sleep, anhedonia, and item-9 (suicidal ideation) items. On the MADRS, it moves reduced sleep, inability to feel, and suicidal thoughts. On the HAM-D, it touches insomnia, work and activities, and the suicide item. In Gottschalk-Gleser terms, “everyone would be better off without me” is a weight-4 self-accusation clause—the single fragment you never want a total to bury.
Coding the evidence span rather than a global impression is what pays off across all four. It lets a reviewer check each rating, lets you compute inter-rater reliability across coders, and surfaces an endorsed suicide item on its own, independent of any total.
On data handling: transcript coding means working with sensitive language, so the sane default is de-identified text and a privacy-first setup. Tagaroo supports a browser-side anonymous mode so transcript content can stay local rather than being uploaded—worth checking against your ethics approval before any real interview data touches a tool.
Common mistakes when comparing depression scales
The costliest mistake is treating the scales as interchangeable measures of one thing. A few others recur:
- Assuming the totals are comparable. A PHQ-9 of 14, a MADRS of 26, and a HAM-D of 20 are not “the same” severity; the scales differ in range, content, and rater. Bridge through percentage change, not raw points.
- Using a screen as a change endpoint. The PHQ-9 is validated for screening at ≥10 (Levis et al., 2019); a clinician severity scale is the better instrument for tracking treatment change.
- Reading one scale’s result as depression in general. Because content overlap is weak, a finding from one scale may not replicate on another (Fried, 2017)—report which scale produced it.
- Ignoring the rater axis. Self-report and clinician-rated scales can diverge on the same patient; pooling them into one change curve mixes two vantage points (von Glischinski et al., 2021).
None of these are reasons to distrust any of the four. They are reasons to report a depression score with its context: the scale, the version, the cutoff, the rater, and whether the number came from a form or from evidence you can point to.
The practical upshot of comparing these depression rating scales side by side: there is no single best scale in the abstract, only a best scale for a defined job. Screen with the PHQ-9, track change with the MADRS, keep legacy comparability with the HAM-D, and measure affect in speech with Gottschalk-Gleser—and remember that each one shows you a different depression. If you code depressive symptoms from interviews, Tagaroo turns the PHQ-9, MADRS, Hamilton scale, and Gottschalk-Gleser scale into guided, evidence-anchored annotation workflows with inter-rater reliability computed as your coders work.
References
- Hamilton, M. (1960). A rating scale for depression. Journal of Neurology, Neurosurgery & Psychiatry, 23(1), 56–62. doi:10.1136/jnnp.23.1.56
- Montgomery, S. A., & Åsberg, M. (1979). A new depression scale designed to be sensitive to change. British Journal of Psychiatry, 134(4), 382–389. doi:10.1192/bjp.134.4.382
- Kroenke, K., Spitzer, R. L., & Williams, J. B. W. (2001). The PHQ-9: validity of a brief depression severity measure. Journal of General Internal Medicine, 16(9), 606–613. doi:10.1046/j.1525-1497.2001.016009606.x
- Gottschalk, L. A., & Hoigaard-Martin, J. (1986). A depression scale applicable to verbal samples. Psychiatry Research, 17(3), 213–227. (Building on Gottschalk, Winget & Gleser, 1969.)
- Gottschalk, L. A., & Gleser, G. C. (1969). The Measurement of Psychological States Through the Content Analysis of Verbal Behavior. University of California Press. doi:10.1525/9780520376762
- Fried, E. I. (2017). The 52 symptoms of major depression: lack of content overlap among seven common depression scales. Journal of Affective Disorders, 208, 191–197. doi:10.1016/j.jad.2016.10.019
- Khan, A., Khan, S. R., Shankles, E. B., & Polissar, N. L. (2002). Relative sensitivity of the Montgomery-Asberg Depression Rating Scale, the Hamilton Depression Rating Scale and the CGI in antidepressant clinical trials. International Clinical Psychopharmacology, 17(6), 281–285. doi:10.1097/00004850-200211000-00003
- Levis, B., Benedetti, A., & Thombs, B. D. (2019). Accuracy of Patient Health Questionnaire-9 (PHQ-9) for screening to detect major depression: individual participant data meta-analysis. BMJ, 365, l1476. doi:10.1136/bmj.l1476
- von Glischinski, M., von Brachel, R., Thiele, C., & Hirschfeld, G. (2021). Not sad enough for a depression trial? A systematic review of depression measures and cut points in clinical trial registrations. Journal of Affective Disorders, 292, 36–44. doi:10.1016/j.jad.2021.05.041
- Guizzaro, L., Morgan, D. D. V., Falco, A., & Gallo, C. (2020). Hamilton scale and MADRS are interchangeable in meta-analyses but can disagree at trial level. Journal of Clinical Epidemiology, 124, 106–117. doi:10.1016/j.jclinepi.2020.04.022
- Williams, J. B. W. (1988). A structured interview guide for the Hamilton Depression Rating Scale (SIGH-D). Archives of General Psychiatry, 45(8), 742–747. doi:10.1001/archpsyc.1988.01800320058007
- Williams, J. B. W., & Kobak, K. A. (2008). Development and reliability of a structured interview guide for the MADRS (SIGMA). British Journal of Psychiatry, 192(1), 52–58. doi:10.1192/bjp.bp.106.032532
- U.S. Food and Drug Administration. Major Depressive Disorder: Developing Drugs for Treatment (draft guidance for industry). FDA guidance document
Frequently asked questions
- What is the best depression rating scale?
- There is no single best depression rating scale; the right one depends on the job. Use the PHQ-9 to screen and self-monitor, the MADRS to detect treatment-related change, the HAM-D for continuity with decades of trial data, and Gottschalk-Gleser content analysis to measure affect from a person's own speech. The scales also sample different symptoms: across seven common depression scales, item overlap is weak and only 'sad mood' appears in all of them (Fried, 2017), so a result found with one scale may not replicate with another.
- What is the difference between the PHQ-9 and the HAM-D?
- The PHQ-9 is a 9-item self-report screen scored 0–27, where the patient rates themselves (Kroenke, Spitzer & Williams, 2001). The HAM-D-17 is a 17-item, clinician-rated severity scale scored 0–52, completed by a trained interviewer (Hamilton, 1960). The PHQ-9 is faster and cheaper and captures the patient's inside view; the HAM-D adds clinical observation but costs rater time and introduces rater subjectivity. They are not interchangeable, and their totals are on different scales.
- Which depression scale is used in clinical trials?
- Clinician-rated scales dominate drug-trial endpoints, while self-report scales are more common in behavioral trials, a split that has widened over 20 years (von Glischinski et al., 2021). The FDA accepts clinician-rated measures (the HAM-D and MADRS among them) as primary endpoints for mood-disorder indications (FDA MDD guidance). The MADRS is favored for its sensitivity to change; the HAM-D-17 retains legacy dominance because six decades of results are denominated in its points.
- Do different depression rating scales measure the same thing?
- Not exactly. A content analysis of seven common depression scales found they encompass 52 distinct symptoms, with a weak mean content overlap (Jaccard index 0.36); 40% of symptoms appear in only one scale and only 'sad mood' is captured specifically by all of them (Fried, 2017). Because the instruments sample different symptom sets, they can disagree, and findings obtained with one scale may not generalize to another.
- Is a self-report depression scale as good as a clinician-rated one?
- Each answers a different question. Self-report scales like the PHQ-9 capture the patient's own perspective, scale cheaply, and are ideal for screening and monitoring. Clinician-rated scales like the HAM-D and MADRS add structured observation and are the accepted primary endpoints for drug trials, at the cost of rater time and rater drift. Patient and clinician ratings can diverge meaningfully, so the choice is about the decision the score feeds, not which is universally 'better.'
Tagaroo builds an annotation tool, so we appear in some comparisons ourselves. How we evaluate tools is documented in our editorial policy.
Keep reading
 Rating Scales
MADRS vs HAM-D: Which Depression Scale Should You Use?
MADRS vs HAM-D compared: items, somatic weighting, sensitivity to change, score conversion, and remission cutoffs. See which depression scale to use.
 Methods & Frameworks
Clinician-Rated vs Self-Report Scales: A Methods Trade-off
Clinician-rated vs self-report scales compared: who rates, the bias each carries, reliability and cost trade-offs, and transcript coding as a third path.
 Rating Scales
PHQ-9 Scoring Explained: Items, Cutoffs, and Coding
PHQ-9 scoring made clear: what the nine items measure, the 0-3 anchors, the severity bands, the ≥10 cutoff, and how to code a PHQ-9 from an interview.
Put this into practice
Tagaroo turns any rating scale or coding scheme into a guided annotation workflow—with inter-rater reliability computed as you go.