Rating Scale vs Coding Scheme: Which Does Your Study Need?
Rating scale vs coding scheme: how dimensional severity and categorical coding change your unit of analysis, reliability statistic, and annotation UI.
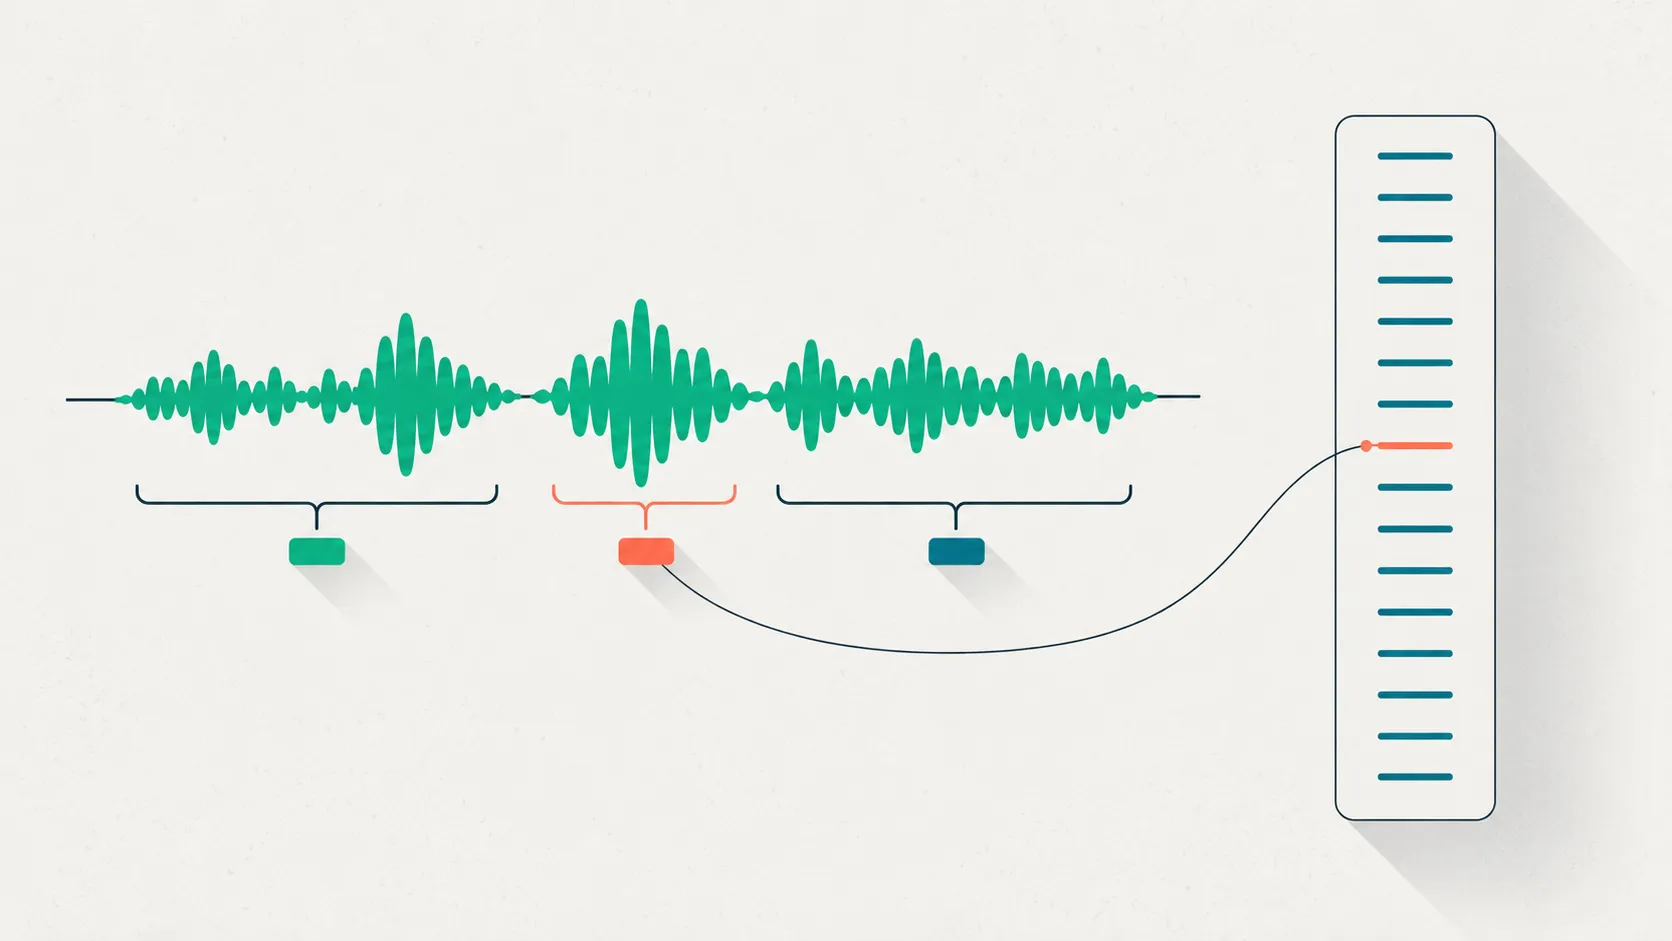
The choice between a rating scale vs coding scheme gets treated as a formatting decision, settled after the real design work is done. It isn’t. It sets what you are measuring, what your unit of analysis is, which reliability coefficient is even valid, and what your annotation screen has to look like. Pick the wrong one and you will compute a clean number that answers a question you never asked.
The distinction is simple to state and easy to blur in practice. A rating scale measures how much: it places a construct on an ordered dimension, like depression severity from none to severe. A coding scheme measures whether and where: it tags a phenomenon as present or absent, usually on a specific stretch of text.
One hands you an ordinal or interval number; the other hands you a categorical label attached to a span. Everything downstream follows from that split.
Rating scale vs coding scheme: what’s the real difference?
The real difference in a rating scale vs coding scheme is the level of measurement you commit to, not the topic you study. A rating scale produces ordered data—values where higher means more of the construct. A coding scheme produces nominal data—labels that name a kind without implying an order. Stevens set out this hierarchy of nominal, ordinal, interval, and ratio scales in 1946, and his central point still holds: the scale type determines which mathematical operations, and which statistics, are permissible on the resulting numbers (Stevens, 1946).
That is why the decision belongs at the top of a study design, not the bottom. Once you know whether your data are ordered or categorical, and whether the thing you measure is a whole unit or a located instance, the instrument and the reliability coefficient are largely determined for you.
| If your data are… | You want a… | Because you measure… | Reliability coefficient |
|---|---|---|---|
| Unordered categories (present/absent, which type) | Coding scheme | Whether a phenomenon occurs (nominal) | Cohen's or Fleiss' kappa; nominal Krippendorff's alpha (Landis & Koch, 1977; Hayes & Krippendorff, 2007) |
| Located stretches of text | Span-level coding scheme | Where it occurs, and its boundaries (nominal + position) | Span F1 / IoU, plus a chance-corrected kappa (Krippendorff, 2018) |
| Ordinal severity anchors (none → severe) | Rating scale | How much is present (ordinal) | Weighted kappa or ordinal Krippendorff's alpha (Cohen, 1968) |
| A summed, continuous total score | Rating scale (summed) | A quantity on an interval-like metric | Intraclass correlation coefficient (Shrout & Fleiss, 1979) |
What does a rating scale actually measure?
A rating scale measures the intensity of a construct on an ordered scale, so its output is a position, not a presence. When a clinician rates reported sadness as 4 rather than 2, the claim is that this interview shows more of the symptom than a 2 would, on a dimension that runs in one direction. The number is meaningful only relative to the anchors that define each step.
The Montgomery-Åsberg Depression Rating Scale (MADRS) is a clean example: ten clinician-rated items, each scored on an ordered 0-to-6 severity anchor, designed to be sensitive to change over treatment (Montgomery & Åsberg, 1979). Nothing in a MADRS item asks where in the interview the sadness appeared; it asks how much is present overall. That is the signature of a rating scale, and it is why the psychometrics of scale development—item selection, response formats, reliability, and validity—are a field of their own (Streiner, Norman & Cairney, 2015).
The subtle trap is treating ordinal ratings as if they were interval. A MADRS item’s steps are ordered, but the distance from 2 to 3 need not equal the distance from 5 to 6. That constraint, again from Stevens (1946), is exactly why you cannot reach for an ordinary Pearson correlation or an unweighted kappa and call it agreement on a severity rating.
What does a coding scheme actually measure?
A coding scheme measures occurrence: whether a defined phenomenon is present and, in text work, where it sits. Its output is a categorical label bound to a unit of text, not a position on a dimension. Coding is the operation that turns raw observation into analyzable categories, and building a good scheme—refining the research question, writing operational definitions with examples, piloting, and revising—is its own disciplined process (Chorney et al., 2015).
Andreasen’s Scale for the Assessment of Thought, Language and Communication (TLC) works this way for disorders of speech: derailment, tangentiality, and the rest are named categories a coder tags when the language shows them (Andreasen, 1986). So does the SANS alogia subscale, which marks features like poverty of speech and poverty of content (Andreasen, 1984). The coder’s first question is not “how much?” but “is this derailment, and which words show it?”
Because occurrence is a nominal judgment, coding schemes inherit the strengths and hazards of categorical data. They capture where the evidence lives, which a global rating throws away, but they are only as sharp as their category boundaries. When two coders split on whether a passage is derailment or tangentiality, that boundary is where your codebook needs a sharper rule—an issue we treat at length in the case for reading annotator disagreement as signal, not noise.
How does the choice change your unit of analysis?
The choice changes your unit of analysis, and that is the consequence most teams overlook. A rating scale’s unit is the thing you rate—an item, an interview, or a subject—so every unit yields exactly one value, and your dataset has a fixed, predictable shape. A coding scheme’s unit is the instance inside the text, so one interview can produce zero, one, or a dozen coded units depending on what the subject said (Bakeman & Gottman, 1997).
That difference propagates through the whole analysis. It sets what a single row of your data represents, how you compute a sample size, and what “an observation” even means when you run statistics. Two studies of the same interviews can report incompatible reliability numbers simply because one rated whole interviews and the other coded spans. Before you pick an instrument, decide what one row of your analysis stands for—and let that decision, not habit, choose the tool.
Which reliability statistic does each need?
Each paradigm needs a reliability statistic that respects its level of measurement, and using the wrong one is a common, quiet error. The governing principle, stated by Hayes and Krippendorff, is that a reliability index must be appropriate to the level of measurement of the data, so it neither ignores the ordering in ordinal data nor invents distances that categorical data do not have (Hayes & Krippendorff, 2007).
For rating scales, that means distance-aware coefficients. On an ordinal severity rating, use weighted kappa, which credits a one-step disagreement more than a four-step one (Cohen, 1968), or ordinal Krippendorff’s alpha. On a continuous or summed total score, use an intraclass correlation coefficient, choosing the form that matches your rater design (Shrout & Fleiss, 1979).
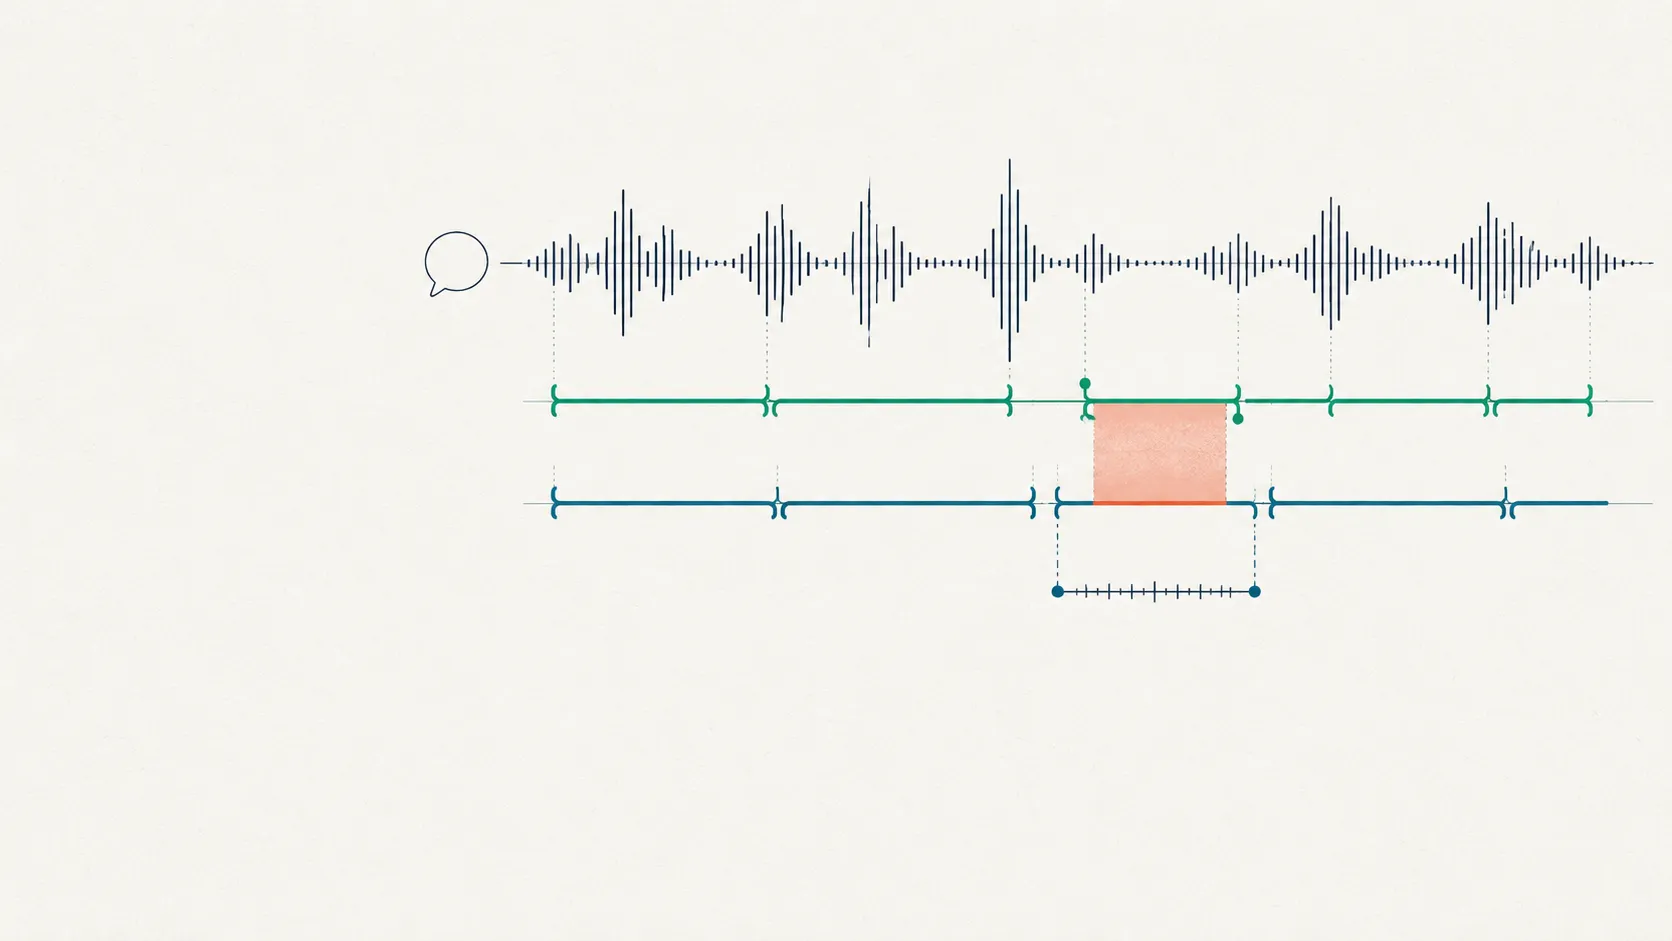
For coding schemes, use chance-corrected agreement on the categories—Cohen’s or Fleiss’ kappa, or nominal alpha—read against a stated benchmark rather than a bare adjective (Landis & Koch, 1977). When the coding is span-level, category agreement is not enough on its own; you also need an overlap metric such as F1 or IoU to score where the coders drew the boundary, which we unpack in the guide to agreement for spans with F1 and IoU. The broader map of which coefficient fits which data type lives in our guide to choosing an inter-rater reliability coefficient.
| Dimension | Rating scale | Coding scheme |
|---|---|---|
| Question it answers | How much? (intensity / severity) | Whether and where? (occurrence) |
| Output | An ordered value | A category label, usually on a span |
| Unit of analysis | The rated unit (item, interview, subject) | The instance or span within the text |
| Measurement level | Ordinal or interval (Stevens, 1946) | Nominal (Stevens, 1946) |
| Typical reliability statistic | Weighted kappa, ordinal alpha, ICC | Kappa, nominal alpha, span F1 / IoU |
| Annotation UI | Anchored buttons or a slider on a unit | Select a span, then pick a label |
| Worked example instrument | MADRS (Montgomery & Åsberg, 1979) | TLC (Andreasen, 1986) |
How does each change your annotation UI?
Each instrument implies a different annotation interface, and the gap is not cosmetic—it shapes what a coder can and cannot record. A rating scale needs a way to assign one ordered value to a whole unit: anchored buttons or a short scale, with the severity definitions visible so the rater applies the same anchors every time. There is often nowhere to attach a specific quote, because the judgment is about the unit as a whole.
A coding scheme needs the opposite: a way to select a specific stretch of text and attach a category to it. The natural interaction is highlight-then-label, and the record it produces is a span plus a code. This is what lets a reviewer see not just that a phenomenon was coded but which words triggered it—the difference between an opinion and a piece of evidence.
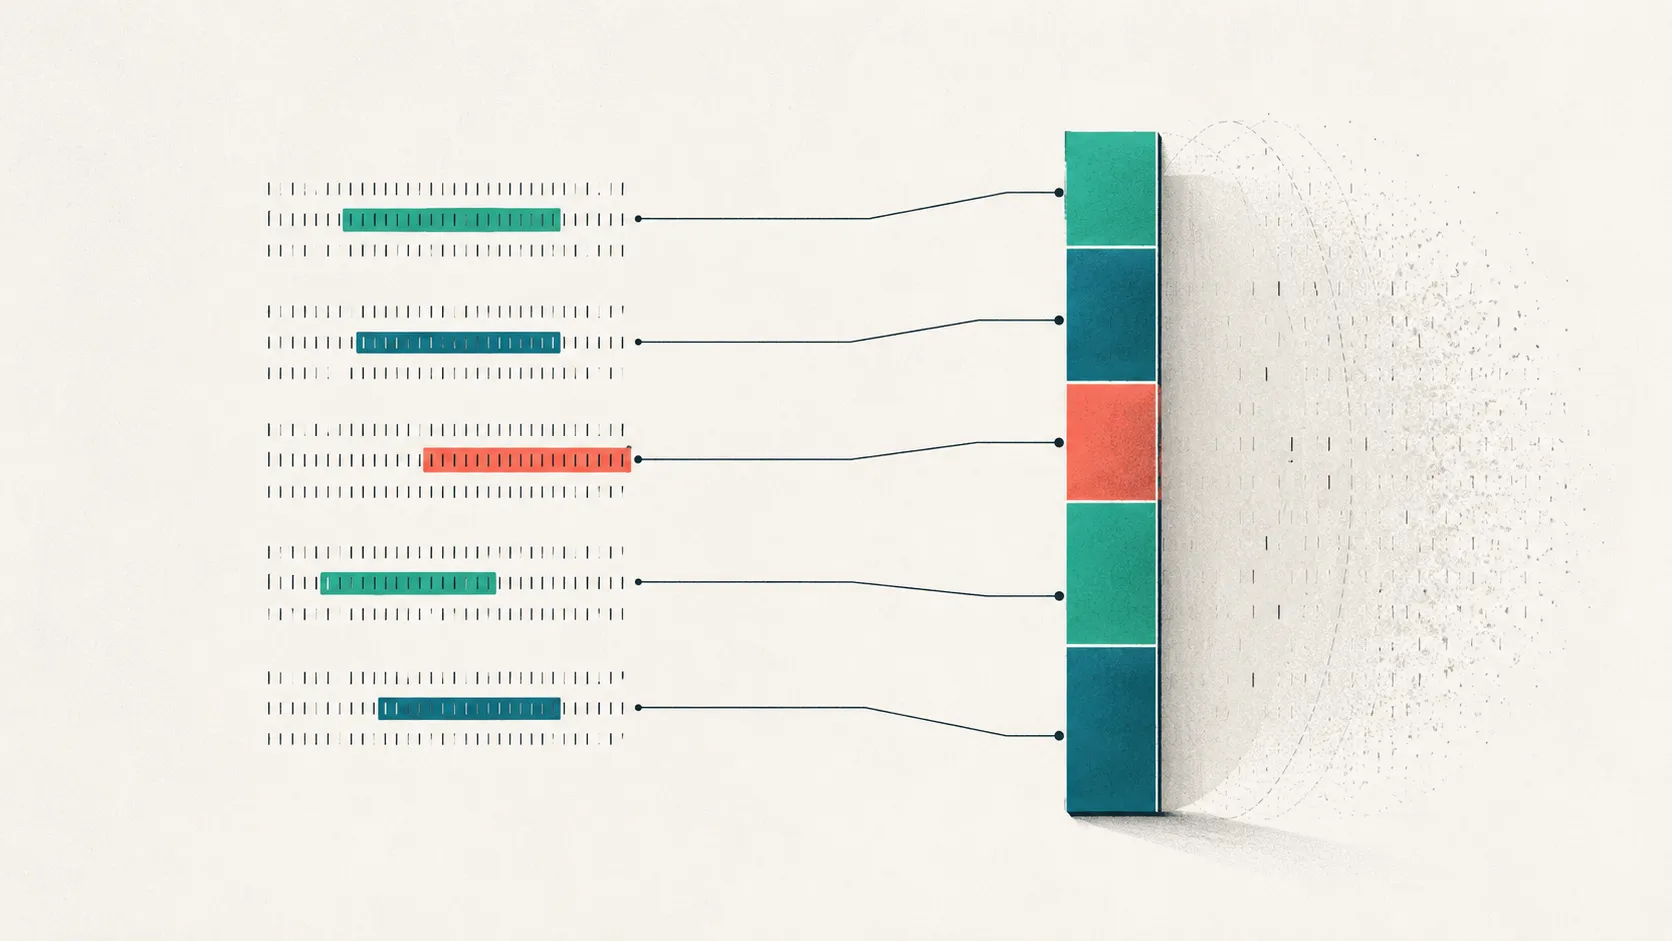
The strongest designs close the gap by attaching evidence to ratings. Rather than record a bare severity number, you mark the passage that justifies it, so the score can be audited back to the transcript instead of resting on the rater’s memory. We make the full argument for that in auditable scale scoring; the short version is that a score you can trace is a score you can defend.
When should you combine both?
You should combine both whenever a severity judgment needs to be traceable to specific evidence—which, in clinical and research transcript work, is most of the time. The pattern is span-grounded rating: first code where the relevant behavior occurs, then rate how much it matters. That keeps the auditability of coding and the graded sensitivity of a rating in one record, and it is close to how careful observational coding already works (Chorney et al., 2015).
Many published instruments are already hybrids, which is a hint that the binary is cleaner in theory than in practice. The TLC does not only tag whether derailment is present; it also rates the severity of each disorder of language over the interview sample (Andreasen, 1986). So the honest framing is not “rating scale or coding scheme” but “which layer is primary, and does the other one need to ride along?” If you are turning a published instrument into an annotation task with both layers, our walkthrough on going from a rating scale to a codebook covers the operational steps.
A worked example: one transcript, scored two ways
Here is a synthetic snippet—invented text, no real interview data—to make the split concrete. Suppose a subject says:
“I don’t know. Everything just feels heavy lately, and the mornings are the worst, and my brother has a red car, he never calls, the phone.”
Score it as a rating scale and you produce ordered values on whole-interview constructs: reported sadness might be rated 4 of 6, and the abrupt slide from mornings to the brother’s car might push an item like concentration difficulties to a 3. One number per item, no marks on the text, agreement measured with weighted kappa.
Score it as a coding scheme and you produce located categories: you highlight “my brother has a red car, he never calls, the phone” and tag it as a derailment instance under the TLC, and you might tag the same span for poverty of content under SANS alogia. Zero-to-many spans per interview, each auditable to the words, agreement measured with kappa on the categories plus overlap on the boundaries.
Same sentence, two datasets with different shapes, different units, and different statistics. Neither is more correct; they answer different questions. The mistake is running one and reporting it as if it had answered the other’s.
Where Tagaroo fits
Tagaroo is a schema-first annotation workspace built to support both paradigms in the same project, so the instrument follows the question instead of the tool. You can define an ordered rating with visible severity anchors, define a categorical coding scheme with span selection, or combine them so a rating carries the highlighted evidence that justifies it. Inter-rater reliability is computed as coders work, with the coefficient chosen to match the measurement level rather than defaulted to whatever is easiest. An AI first pass can pre-highlight candidate spans or suggest a rating, but it never issues a finished label and never a diagnosis.
On data handling, Tagaroo takes a de-identify-first path: its terms require you to strip direct identifiers before upload, its anonymous trial mode runs in the browser so trial text stays on your machine, and the stack is EU-hosted and GDPR-oriented. It is not a medical device. If your workflow must process raw identifiable transcripts in the cloud, put that question to any vendor—including this one—before uploading; see the privacy policy for specifics.
The practical upshot
Decide the rating scale vs coding scheme question first, because it silently sets your unit of analysis, your reliability statistic, and your annotation screen before you code a single transcript. If you want intensity on an ordered dimension, build a rating scale and score its agreement with weighted kappa or an ICC. If you want occurrence on a located span, build a coding scheme and score it with kappa plus an overlap metric. If you want both—an auditable severity—combine them deliberately rather than by accident.
If you change one thing, change this: write down what one row of your analysis represents before you choose the instrument, and let that answer pick the tool. Then build the scale or scheme in Tagaroo with the matching reliability coefficient in the loop, and let the instrument answer the question you actually asked.
References
- Stevens, S. S. (1946). On the Theory of Scales of Measurement. Science, 103(2684), 677–680. doi:10.1126/science.103.2684.677
- Hayes, A. F., & Krippendorff, K. (2007). Answering the Call for a Standard Reliability Measure for Coding Data. Communication Methods and Measures, 1(1), 77–89. doi:10.1080/19312450709336664
- Krippendorff, K. (2018). Content Analysis: An Introduction to Its Methodology (4th ed.). SAGE Publications. Publisher
- Streiner, D. L., Norman, G. R., & Cairney, J. (2015). Health Measurement Scales: A Practical Guide to Their Development and Use (5th ed.). Oxford University Press. Publisher
- Cohen, J. (1968). Weighted kappa: Nominal scale agreement with provision for scaled disagreement or partial credit. Psychological Bulletin, 70(4), 213–220. doi:10.1037/h0026256
- Shrout, P. E., & Fleiss, J. L. (1979). Intraclass correlations: Uses in assessing rater reliability. Psychological Bulletin, 86(2), 420–428. doi:10.1037/0033-2909.86.2.420
- Landis, J. R., & Koch, G. G. (1977). The measurement of observer agreement for categorical data. Biometrics, 33(1), 159–174. doi:10.2307/2529310
- Chorney, J. M., McMurtry, C. M., Chambers, C. T., & Bakeman, R. (2015). Developing and Modifying Behavioral Coding Schemes in Pediatric Psychology: A Practical Guide. Journal of Pediatric Psychology, 40(1), 154–164. doi:10.1093/jpepsy/jsu099
- Bakeman, R., & Gottman, J. M. (1997). Observing Interaction: An Introduction to Sequential Analysis (2nd ed.). Cambridge University Press.
- Montgomery, S. A., & Åsberg, M. (1979). A new depression scale designed to be sensitive to change. British Journal of Psychiatry, 134, 382–389. doi:10.1192/bjp.134.4.382
- Andreasen, N. C. (1986). The Scale for the Assessment of Thought, Language, and Communication (TLC). Schizophrenia Bulletin, 12(3), 473–482. doi:10.1093/schbul/12.3.473
- Andreasen, N. C. (1984). The Scale for the Assessment of Negative Symptoms (SANS). Iowa City: University of Iowa.
Frequently asked questions
- What is the difference between a rating scale and a coding scheme?
- A rating scale assigns a value on an ordered dimension—how much of a construct is present, such as depression severity from none to severe (Montgomery & Åsberg, 1979). A coding scheme assigns an unordered category—whether, and often where, a phenomenon occurs, such as tagging each instance of derailment in speech (Andreasen, 1986). The first produces an ordinal or interval number; the second produces a nominal label, frequently attached to a located span of text (Stevens, 1946).
- Which reliability statistic should I use for a rating scale versus a coding scheme?
- Match the coefficient to the measurement level (Hayes & Krippendorff, 2007). For an ordinal severity rating, use weighted kappa or ordinal Krippendorff's alpha so a near miss costs less than a far one (Cohen, 1968). For a continuous or interval total score, use an intraclass correlation coefficient (Shrout & Fleiss, 1979). For unordered coding categories, use Cohen's or Fleiss' kappa or nominal alpha, and for located spans add an overlap metric such as F1 or IoU (Landis & Koch, 1977; Krippendorff, 2018).
- Does the choice change my unit of analysis?
- Yes, and this is the consequence people miss. A rating scale's unit is the thing being rated—an item, an interview, or a subject—so you get one value per unit. A coding scheme's unit is the instance or span inside the text, so a single interview can yield zero, one, or many coded units (Bakeman & Gottman, 1997). Your reliability analysis, sample size, and statistics all follow from which unit you chose.
- Can I use a rating scale and a coding scheme together?
- Often you should. A common pattern is span-grounded rating: code where the evidence occurs, then rate how severe it is, so the number is auditable back to the transcript (Chorney et al., 2015). Many published instruments are already hybrids—the TLC tags each disorder of language as a category and then rates its severity (Andreasen, 1986).
- Is a Likert questionnaire a rating scale or a coding scheme?
- A Likert item is a rating scale: it places a response on an ordered dimension from, for example, strongly disagree to strongly agree, which is ordinal-level data (Stevens, 1946; Streiner, Norman & Cairney, 2015). A coding scheme would instead ask whether a given theme is present in an open-text answer and, if so, mark the passage that shows it.
Keep reading
 Reliability & Agreement
Which Inter-Rater Reliability Coefficient Should You Use?
Which inter-rater reliability coefficient to use, by data type, rater count, and missing data—a decision guide to kappa, alpha, AC1, and ICC.
 Reliability & Agreement
Span-Level Agreement: Why Kappa Fails, Use F1 and IoU
Cohen's kappa needs a fixed item set that span and NER annotation never has. Measure span-level agreement with pairwise F1 and IoU instead—see how.
 Rating Scales
Auditable Clinical Ratings: Score From the Transcript
Build an auditable clinical rating by tying every scale item to a quoted line, not a global impression. See how span-grounded scoring works.
Put this into practice
Tagaroo turns any rating scale or coding scheme into a guided annotation workflow—with inter-rater reliability computed as you go.