Clinician-Rated vs Self-Report Scales: A Methods Trade-off
Clinician-rated vs self-report scales compared: who rates, the bias each carries, reliability and cost trade-offs, and transcript coding as a third path.
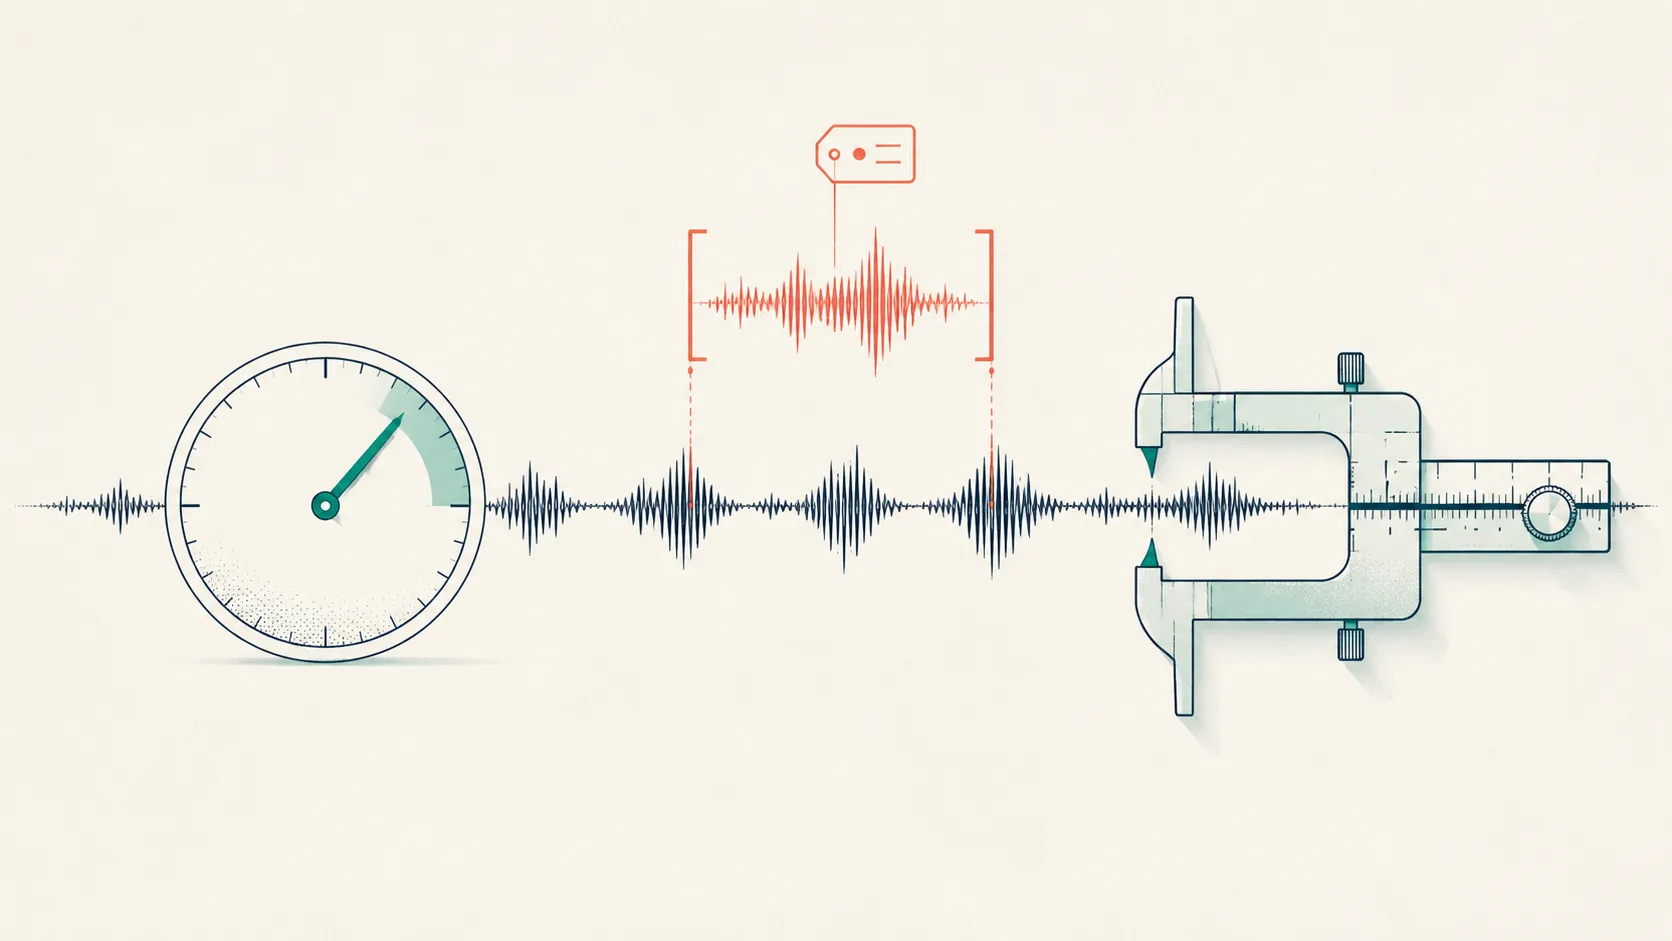
Clinician-rated vs self-report is not a quality contest. It’s a choice about who does the judging and, therefore, which biases you agree to live with. A self-report scale like the PHQ-9 or GAD-7 hands the rating to the patient; a clinician-rated scale like the HAM-D, MADRS, or HAM-A hands it to a trained interviewer.
Each mode buys something real and pays for it somewhere else. This piece uses Tagaroo’s own scale library as the worked example set, lays the trade-off out on one table, and argues that transcript-based coding is a third path: an observer rating without a live rater in the room.
What’s the difference between clinician-rated and self-report scales?
The difference is who assigns the score. A self-report scale is completed by the patient, who reads each item and rates their own experience; a clinician-rated (observer-rated) scale is scored by a trained interviewer from what the patient says and how they present. The construct can be identical—depression severity—while the measurement mode, and its biases, differ completely.
Tagaroo’s library holds both families, which makes it a convenient example set. The PHQ-9 and GAD-7 are self-report: the person answers nine or seven items on a 0–3 frequency scale and the numbers are summed. The HAM-D, MADRS, and HAM-A are clinician-rated: a trained rater interviews the patient, then scores each item on the instrument’s anchors. Same target constructs—depression and anxiety severity—two very different routes to a number.
| Scale | Mode | Rater | Items / range | Primary source |
|---|---|---|---|---|
| PHQ-9 | Self-report | The patient | 9 items, 0–27 | Kroenke et al., 2001 |
| GAD-7 | Self-report | The patient | 7 items, 0–21 | Spitzer et al., 2006 |
| HAM-D (HDRS-17) | Clinician-rated | Trained interviewer | 17 items, 0–52 | Hamilton, 1960 |
| MADRS | Clinician-rated | Trained interviewer | 10 items, 0–60 | Montgomery & Åsberg, 1979 |
| HAM-A | Clinician-rated | Trained interviewer | 14 items, 0–56 | Hamilton, 1959 |
There is a formal vocabulary for this split. Regulators classify measures by who reports the outcome: a Patient-Reported Outcome (PRO) comes directly from the patient with no interpretation by anyone else, while a Clinician-Reported Outcome (ClinRO) is a rating that requires specialized professional training and the clinician’s judgment to produce (FDA, 2022; Powers et al., 2017). The PHQ-9 is a PRO; the MADRS is a ClinRO. That is not jargon for its own sake—the category determines which biases you have to defend against.
The clinician-rated vs self-report trade-off, on one table
The clinician-rated vs self-report choice comes down to a handful of axes, and they pull in opposite directions: what one mode makes cheap, the other makes reliable. The table below sets them side by side, with the library scales as worked examples. It is the fastest way to see that neither mode is “better”—each is better at something.
| Axis | Self-report (PHQ-9, GAD-7) | Clinician-rated (HAM-D, MADRS, HAM-A) |
|---|---|---|
| Who scores it | The patient | A trained interviewer |
| Dominant bias | Social desirability, recall, response style | Rater drift, expectancy, halo |
| Insight-dependence | High—needs accurate self-appraisal | Lower—clinician infers from presentation |
| Reliability bottleneck | Test–retest; reading level | Inter-rater reliability (training + structured guide) |
| Anchor granularity | Coarse (0–3 frequency) | Finer (0–4 / 0–6 severity) |
| Cost & time | Minutes, self-administered, often free | Trained rater, ~15–30 min (approx.), certification |
| Best at | Screening, repeated monitoring, scale | Severity grading, trial endpoints |
Read the table as a set of purchases. Self-report buys speed, scale, and the patient’s privileged access to their own inner state, and pays with the biases of self-appraisal. Clinician rating buys a calibrated, finely graded judgment and pays with the cost of training raters and the constant threat that they drift apart. The rest of this piece works down those rows.
How much do self-report and clinician ratings actually disagree?
They disagree modestly in size but systematically in direction, and the disagreement is a property of the measurement, not random noise. Head-to-head, self-report and clinician scales correlate only moderately: across the large GENDEP and STAR*D samples, the self-report BDI correlated 0.58 with the MADRS and 0.48 with the clinician-rated HAM-D, and even matched QIDS self and clinician versions correlated just 0.69—weaker than the 0.77 between two clinician scales (Uher et al., 2012). Agreement also climbs over a course of treatment, from roughly 0.4 at baseline toward 0.7 at endpoint (Möller, 2000). The two modes track the same construct; they are not interchangeable score-for-score.
The cleanest evidence on the direction of the gap comes from scales built in matched pairs. Rush and colleagues compared the self-report and clinician versions of the same depression inventories in 544 outpatients: the self-report IDS-SR-30 ran on average 2.2 points higher (more severe) than the clinician-rated IDS-C-30 at baseline, while the briefer QIDS versions differed by just 0.3 points (Rush et al., 2006); in the same program, the clinician and self-report QIDS versions agreed on remission classification 94% of the time and on response 88% (Bernstein et al., 2006). On a well-matched instrument, self-report skews slightly toward reporting more severity, but the clinical conclusions largely converge.
Who over-reports is partly predictable. In SCID-confirmed depressed outpatients, younger and more educated patients, and those with atypical or non-melancholic depression, tended to rate themselves as more depressed than the clinician did (Enns et al., 2000). That is the shape of the disagreement: not a coin-flip, but a lean that tracks who the patient is.
At the level of trial outcomes the direction flips and matters more. Pooling 48 psychotherapy trials that used both a self-report and a clinician-rated measure, Cuijpers and colleagues found clinician-rated instruments produced a larger treatment effect than self-report from the same patients (Δg = 0.20, 95% CI 0.10–0.30); restricting to studies comparing the HAM-D against the BDI, the gap held at Δg = 0.15 (Cuijpers et al., 2010). Their conclusion was blunt: the two are “not equivalent,” and trials should include both.
A 2025 replication complicates the story in a useful way. Across 91 trials and 283 effect sizes, the differential shrank to Δg = 0.12, and—critically—the gap was almost entirely an artifact of unmasked raters: blinded clinician ratings and self-report were nearly identical (Δg = 0.10), while for general-adult samples they were statistically indistinguishable (Miguel et al., 2025). The authors’ reading is worth quoting: self-report “did not overestimate the effects of psychotherapy” and patients’ perception of improvement “should not be considered less valid by default.” The older finding that clinicians see bigger effects is partly the sound of clinicians who knew which arm the patient was in.
Where self-report scales are biased
Self-report’s biases all stem from a single fact: the instrument depends on the person accurately knowing, and honestly reporting, their own state. That is a strength when the construct is inherently subjective—no one else has better access to your worry or your low mood—and a liability when self-appraisal is exactly what the illness distorts.
Three failure modes recur. Social desirability pushes answers toward what feels acceptable to admit, muting stigmatized items—a bias documented across self-report clinical-psychology measures (Perinelli & Gremigni, 2016). Insight and recall set a ceiling on accuracy: a person has to notice a symptom, attribute it correctly, and remember its frequency over two weeks to rate it, and depression can blunt all three. Response style—acquiescence, extreme-versus-midpoint preference, reading level—adds noise that has nothing to do with symptoms.
None of these are fatal, but together they are why a PHQ-9 total is read as a screen to act on, not a verdict, as the PHQ-9 scoring guide works through in detail.
The coarse anchors compound it. Self-report items typically offer four frequency levels (0–3: not at all, several days, more than half the days, nearly every day), which caps how finely a person can grade themselves and flattens the top and bottom of the range. A patient who is severely unwell and one who is catastrophically unwell can both land at the ceiling of a 0–3 item. That granularity gap is one reason clinician scales, with their 0–4 and 0–6 anchors, are preferred where fine severity grading is the point.
Where clinician-rated scales are biased
Clinician rating trades the patient’s self-appraisal for a trained observer’s judgment, and inherits a different problem: two trained observers watching the same patient can disagree. The bias is not in any one rater’s head but in the variance between raters, and it is large enough to sink a study if left unmanaged.
The number that makes this concrete comes from central-rating research. Comparing site raters against blinded centralized raters on the same patients, mean placebo-arm HAM-D change was 7.52 under site raters versus 3.18 under central raters—unreliable rating more than doubled the apparent placebo response (Kobak et al., 2010). That gap is manufactured entirely by how the scale was administered, not by the drug or the disease.
The defenses are well established and expensive: a structured interview guide (the SIGH-D for the HAM-D; Williams, 1988) to standardize the probes, rater training and certification, and ongoing surveillance of inter-rater reliability so drift is caught before it contaminates an endpoint. There is also an expectancy channel—the Miguel replication showed the self-report-versus-clinician gap widened when raters were unmasked, evidence that a clinician who knows the treatment arm can nudge the score (Miguel et al., 2025). And on scales like the HAM-A, somatic items can quietly register a drug’s side effects rather than its target symptom (Bagby et al., 2004, on the analogous HAM-D critique). Clinician rating is not more objective by default; it is objective only to the extent the rating system is disciplined.
Is observer rating the same as clinician rating?
Not quite—and the gap is where the third path lives. “Observer-rated” means the score comes from someone other than the patient; “clinician-rated” is the special case where that observer is a trained clinician scoring live. The regulatory framework splits them: a ClinRO requires professional training and judgment, while an Observer-Reported Outcome (ObsRO) is a rating by a non-clinician third party, such as a caregiver (Powers et al., 2017). Separate the observer role from the live clinician role and a question opens up: could an observer rate the scale from a record of the interview, after the fact, without being the clinician in the room?
Transcript-based coding: an observer rating without a live rater
There is a third measurement mode that most administration-mode debates skip. In transcript-based coding, an observer rates the scale from a recorded interview, attaching each item to the exact words that justify it—an observer rating produced without a clinician scoring live, and without handing a form to the patient. It keeps the calibrated observer’s judgment from the clinician-rated column while removing two of that column’s costs: the drift of live, in-session scoring, and the opacity of a total nobody can audit.
The mechanics are simple: code the span where the subject reports each symptom, then rate that evidence on the instrument’s own anchors. Consider a short synthetic exchange, coded the way a transcript rater would:
Interviewer: How have things felt this past couple of weeks?
Subject: I can’t shake the sense that I’ve let everyone down, and most nights I’m awake until three just going over it.
On the HAM-D, that reply grounds the guilt item (“let everyone down”) and an insomnia item (“awake until three”), each rating pinned to its own span. On a self-report form the same experience would be two checkbox frequencies with no evidence attached; live, it would be a rater’s global impression. Coding the evidence is what lets a second observer check every rating against the transcript and lets you compute inter-rater reliability across coders—the discipline the clinician-rated column needs and the self-report column can’t offer.
The HAM-D card above shows Tagaroo’s 11 content-localizable coding items—the ones a transcript can actually ground—which is a subset of the published 17-item HDRS-17 (Hamilton, 1960), not a re-scoring of its 0–52 total. This is the workflow Tagaroo is built for, across both families: run a self-report scale like the PHQ-9 as evidence-anchored coding, or a clinician-rated one like the HAM-D, and get an auditable score either way. On data handling: transcript coding means working with sensitive clinical language, so the sane default is de-identified text and a privacy-first setup. Tagaroo supports a browser-side anonymous mode so transcript content can stay local rather than being uploaded—worth checking against your ethics approval before any real interview data touches a tool.
Clinician-rated vs self-report: which should you use?
Pick the mode for the decision it feeds, not its prestige. The evidence points to a clean set of rules.
- Choose self-report (the PHQ-9, GAD-7) when you need to screen or monitor at scale, when the construct is inherently subjective, when cost and patient time are the binding constraints, or when you specifically want the patient’s own view of improvement—which the trial evidence says you should not discount (Miguel et al., 2025).
- Choose clinician-rated (the HAM-D, MADRS, HAM-A) when you need fine severity grading, a legacy-comparable trial endpoint, or a judgment that does not depend on the patient’s insight—and budget for the structured guide, rater training, and inter-rater reliability that make it trustworthy.
- Collect both when you can. The two modes disagree in predictable directions and capture partly different information; the meta-analytic advice is to measure both rather than treat either as ground truth (Cuijpers et al., 2010). Observer-rated scales carry the primary weight for reliability and validity, while self-report adds “a meaningful complementary view”—the patient’s own perception of illness and recovery (Möller, 2009).
- Whichever you pick, make the score auditable. Evidence-anchored transcript coding gives you a clinician-grade observer rating with the reliability surveillance a self-report form can’t support and the transparency a live rating rarely does.
The practical upshot of clinician-rated vs self-report: it is a trade among biases, not a ranking of accuracy. Self-report is fast, scalable, and honest about the patient’s inside view; clinician rating is finer-grained and calibrated but only as reliable as its raters. If you code either family from interviews, Tagaroo turns self-report scales like the PHQ-9 and clinician-rated ones like the HAM-D into a guided, evidence-anchored workflow, with inter-rater reliability computed as your coders work. For the scale-versus-scale versions of this question, see the MADRS vs HAM-D head-to-head, the depression rating scales compared overview, and the anxiety pairing in GAD-7 vs HAM-A and the Hamilton Anxiety Rating Scale guide.
References
- Cuijpers, P., Li, J., Hofmann, S. G., & Andersson, G. (2010). Self-reported versus clinician-rated symptoms of depression as outcome measures in psychotherapy research on depression: a meta-analysis. Clinical Psychology Review, 30(6), 768–778. doi:10.1016/j.cpr.2010.06.001
- Miguel, C., Harrer, M., Karyotaki, E., Plessen, C. Y., Čihařová, M., Furukawa, T. A., et al. (2025). Self-reports vs clinician ratings of efficacies of psychotherapies for depression: a meta-analysis of randomized trials. Epidemiology and Psychiatric Sciences, 34, e12. doi:10.1017/S2045796025000095
- Rush, A. J., Carmody, T. J., Ibrahim, H. M., Trivedi, M. H., Biggs, M. M., Shores-Wilson, K., et al. (2006). Comparison of self-report and clinician ratings on two inventories of depressive symptomatology. Psychiatric Services, 57(6), 829–837. doi:10.1176/ps.2006.57.6.829
- Bernstein, I. H., Rush, A. J., Carmody, T. J., Woo, A., & Trivedi, M. H. (2006). Clinical vs. self-report versions of the Quick Inventory of Depressive Symptomatology in a public sector sample. Journal of Psychiatric Research, 41(3–4), 239–246. doi:10.1016/j.jpsychires.2006.04.001
- Uher, R., Perlis, R. H., Placentino, A., Dernovšek, M. Z., Henigsberg, N., Mors, O., Maier, W., McGuffin, P., & Farmer, A. (2012). Self-report and clinician-rated measures of depression severity: can one replace the other? Depression and Anxiety, 29(12), 1043–1049. doi:10.1002/da.21993
- Enns, M. W., Larsen, D. K., & Cox, B. J. (2000). Discrepancies between self and observer ratings of depression: the relationship to demographic, clinical and personality variables. Journal of Affective Disorders, 60(1), 33–41. doi:10.1016/S0165-0327(99)00156-1
- Möller, H. J. (2000). Rating depressed patients: observer- vs self-assessment. European Psychiatry, 15(3), 160–172. doi:10.1016/S0924-9338(00)00229-7
- Möller, H. J. (2009). Standardised rating scales in psychiatry: methodological basis, their possibilities and limitations and descriptions of important rating scales. The World Journal of Biological Psychiatry, 10(1), 6–26. doi:10.1080/15622970802264606
- Perinelli, E., & Gremigni, P. (2016). Use of social desirability scales in clinical psychology: a systematic review. Journal of Clinical Psychology, 72(6), 534–551. doi:10.1002/jclp.22284
- Powers, J. H., Patrick, D. L., Walton, M. K., Marquis, P., Cano, S., Hobart, J., et al. (2017). Clinician-reported outcome assessments of treatment benefit: report of the ISPOR Clinical Outcome Assessment Emerging Good Practices Task Force. Value in Health, 20(1), 2–14. doi:10.1016/j.jval.2016.11.005
- Kroenke, K., Spitzer, R. L., & Williams, J. B. W. (2001). The PHQ-9: validity of a brief depression severity measure. Journal of General Internal Medicine, 16(9), 606–613. doi:10.1046/j.1525-1497.2001.016009606.x
- Spitzer, R. L., Kroenke, K., Williams, J. B. W., & Löwe, B. (2006). A brief measure for assessing generalized anxiety disorder: the GAD-7. Archives of Internal Medicine, 166(10), 1092–1097. doi:10.1001/archinte.166.10.1092
- Hamilton, M. (1960). A rating scale for depression. Journal of Neurology, Neurosurgery & Psychiatry, 23(1), 56–62. doi:10.1136/jnnp.23.1.56
- Montgomery, S. A., & Åsberg, M. (1979). A new depression scale designed to be sensitive to change. British Journal of Psychiatry, 134(4), 382–389. doi:10.1192/bjp.134.4.382
- Hamilton, M. (1959). The assessment of anxiety states by rating. British Journal of Medical Psychology, 32(1), 50–55. doi:10.1111/j.2044-8341.1959.tb00467.x
- Kobak, K. A., Leuchter, A., DeBrota, D., Engelhardt, N., Williams, J. B. W., Cook, I. A., et al. (2010). Site versus centralized raters in a clinical depression trial. Journal of Clinical Psychopharmacology, 30(2), 193–197. doi:10.1097/JCP.0b013e3181d20912
- Williams, J. B. W. (1988). A structured interview guide for the Hamilton Depression Rating Scale (SIGH-D). Archives of General Psychiatry, 45(8), 742–747. doi:10.1001/archpsyc.1988.01800320058007
- Bagby, R. M., Ryder, A. G., Schuller, D. R., & Marshall, M. B. (2004). The Hamilton Depression Rating Scale: has the gold standard become a lead weight? American Journal of Psychiatry, 161(12), 2163–2177. doi:10.1176/appi.ajp.161.12.2163
- U.S. Food and Drug Administration. (2018). Major Depressive Disorder: Developing Drugs for Treatment (draft guidance for industry). FDA guidance document
- U.S. Food and Drug Administration. (2022). Patient-Focused Drug Development: Selecting, Developing, or Modifying Fit-for-Purpose Clinical Outcome Assessments (guidance for industry). FDA guidance document
Frequently asked questions
- What is the difference between clinician-rated and self-report scales?
- The difference is who assigns the score. A self-report scale is completed by the patient, who reads each item and rates their own experience; a clinician-rated (observer-rated) scale is scored by a trained interviewer from what the patient says and how they present. The PHQ-9 and GAD-7 are self-report; the HAM-D, MADRS, and HAM-A are clinician-rated. The construct can be identical—depression or anxiety severity—while the measurement mode, and the biases that come with it, differ completely.
- Are self-report scales less accurate than clinician-rated scales?
- Not inherently. On matched instruments the two agree substantially: the clinician and self-report versions of the QIDS agreed on remission classification 94% of the time (Bernstein et al., 2006), though the self-report ran about 2.2 points higher on the fuller IDS (Rush et al., 2006). In psychotherapy trials, blinded clinician ratings and self-report produced almost identical effect sizes; the gap only opened when raters were unmasked (Miguel et al., 2025). Self-report carries different biases, not more error.
- Why do self-report and clinician ratings of depression disagree?
- They disagree systematically because each mode is biased in its own direction. Self-report is shaped by social desirability, recall, insight, and how a person reads the items; clinician rating is shaped by rater drift, expectancy, and the interviewer's calibration. Across 48 psychotherapy trials, clinician-rated instruments showed a larger treatment effect than self-report from the same patients (Δg = 0.20; Cuijpers et al., 2010)—a difference in the measurement, not the patients.
- Which is better for clinical trials, clinician-rated or self-report?
- Clinician-rated scales like the HAM-D and MADRS are the accepted primary endpoints in depression registration trials—the FDA's major-depressive-disorder guidance lists both (FDA, 2018)—but self-report is increasingly collected alongside them. The meta-analytic advice is to measure both, because they capture partly different information and disagree in predictable ways (Cuijpers et al., 2010; Miguel et al., 2025). Whichever you lead with, budget for inter-rater reliability if a human rater assigns the score.
- Can you get an observer rating without a live clinician?
- Yes—transcript-based coding is a third path. An observer rates the scale from a recorded interview, attaching each item to the exact words that justify it, rather than scoring live or handing a form to the patient. It keeps the calibrated observer's judgment while making every rating auditable and reproducible enough to compute inter-rater reliability across coders.
Tagaroo builds an annotation tool, so we appear in some comparisons ourselves. How we evaluate tools is documented in our editorial policy.
Keep reading
 Rating Scales
PHQ-9 Scoring Explained: Items, Cutoffs, and Coding
PHQ-9 scoring made clear: what the nine items measure, the 0-3 anchors, the severity bands, the ≥10 cutoff, and how to code a PHQ-9 from an interview.
 Rating Scales
MADRS vs HAM-D: Which Depression Scale Should You Use?
MADRS vs HAM-D compared: items, somatic weighting, sensitivity to change, score conversion, and remission cutoffs. See which depression scale to use.
 Rating Scales
Hamilton Anxiety Rating Scale: Psychic vs Somatic HAM-A
The Hamilton Anxiety Rating Scale (HAM-A) is a 14-item clinician measure. See the psychic and somatic items, the scoring, the cutoffs, and how to code it.
Put this into practice
Tagaroo turns any rating scale or coding scheme into a guided annotation workflow—with inter-rater reliability computed as you go.